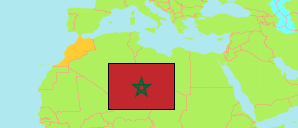
Tiznit
Province in Souss-Massa Region
Contents: Subdivision
The population development in Tiznit as well as related information and services (Wikipedia, Google, images).
| Name | Status | Native | Population Census 1994-09-02 | Population Census 2004-09-02 | Population Census 2014-09-01 | Population Census 2024-09-01 | |
|---|---|---|---|---|---|---|---|
| Tiznit | Province | تيزنيت | 214,166 | 217,050 | 207,367 | 198,542 | |
| Afella Ighir | Rural Commune | أفلا اغير | 3,978 | 4,205 | 2,973 | 2,446 | → |
| Aït Issafen | Rural Commune | أيت ايسافن | 5,620 | 5,026 | 3,293 | 2,497 | → |
| Aït Ouafqa | Rural Commune | أيت وافقا | 6,270 | 5,472 | 4,210 | 3,376 | → |
| Ammelne | Rural Commune | املن | 4,847 | 4,281 | 3,603 | 2,782 | → |
| Anzi | Rural Commune | انزي | 7,033 | 6,619 | 7,658 | 6,199 | → |
| Arbaa Aït Ahmed | Rural Commune | اربعاء أيت أحمد | 8,867 | 8,228 | 5,257 | 3,918 | → |
| Arbaa Rasmouka | Rural Commune | أربعاء رسموكة | 8,119 | 7,503 | 5,964 | 4,620 | → |
| Arbaa Sahel | Rural Commune | أربعاء الساحل | 13,561 | 12,944 | 10,705 | 8,820 | → |
| Bounaamane | Rural Commune | بونعمان | 12,572 | 12,112 | 10,310 | 8,932 | → |
| El Maader El Kabir | Rural Commune | المعدر الكبير | 8,365 | 7,918 | 6,885 | 6,009 | → |
| Ida Ou Gougmar | Rural Commune | إد او كوكمار | 8,482 | 8,170 | 5,792 | 4,250 | → |
| Irigh N'Tahala | Rural Commune | ايريغ نتاهلة | 2,466 | 1,992 | 1,577 | 1,417 | → |
| Ouijjane | Rural Commune | ويجان | 7,443 | 6,472 | 4,938 | 4,079 | → |
| Reggada | Rural Commune | الركادة | 13,680 | 14,328 | 13,284 | 12,521 | → |
| Sidi Ahmed Ou Moussa | Rural Commune | سيدي أحمد أو موسى | 3,960 | 4,256 | 3,679 | 3,339 | → |
| Sidi Bouabdelli | Rural Commune | سيدي بوعبد اللي | 6,975 | 6,826 | 5,758 | 4,610 | → |
| Tafraout | Urban Commune | تافراوت | 3,949 | 4,931 | 6,345 | 6,124 | → |
| Tafraout El Mouloud | Rural Commune | تفراوت المولود | 4,477 | 3,619 | 3,200 | 2,014 | → |
| Tarsouat | Rural Commune | تارسوات | 3,682 | 3,096 | 2,375 | 2,001 | → |
| Tassrirt | Rural Commune | تاسريرت | 2,396 | 1,887 | 1,554 | 1,130 | → |
| Tighmi | Rural Commune | تيغمي | 10,383 | 9,867 | 6,396 | 5,492 | → |
| Tiznit | Urban Commune | تزنيت | 43,001 | 53,682 | 74,699 | 86,595 | → |
| Tizoughrane | Rural Commune | تيزغران | 7,723 | 6,250 | 4,769 | 3,725 | → |
| Tnine Aday | Rural Commune | اثنين أداي | 3,488 | 2,734 | 1,903 | 1,696 | → |
| Tnine Aglou | Rural Commune | اثنين اكلو | 12,829 | 14,632 | 10,240 | 9,950 | → |
| Souss - Massa | Region | سوس - ماسة | 1,926,288 | 2,324,142 | 2,676,847 | 3,020,431 |
Source: Haut Commissariat au Plan, Royaume du Maroc.
Explanation: Area figures are calculated using geospatial data. Some population changes are due to boundary changes.
Further information about the population structure:
| Gender (C 2014) | |
|---|---|
| Males | 95,875 |
| Females | 109,307 |
| Age Groups (C 2014) | |
|---|---|
| 0-14 years | 51,395 |
| 15-64 years | 131,313 |
| 65+ years | 22,474 |
| Age Distribution (C 2014) | |
|---|---|
| 70+ years | 16,283 |
| 60-69 years | 14,618 |
| 50-59 years | 20,233 |
| 40-49 years | 26,543 |
| 30-39 years | 28,747 |
| 20-29 years | 30,327 |
| 10-19 years | 34,532 |
| 0-9 years | 33,899 |
| Urbanization (C 2024) | |
|---|---|
| Rural | 105,823 |
| Urban | 92,719 |
| Citizenship (C 2024) | |
|---|---|
| Morocco | 198,367 |
| Foreign Citizenship | 175 |