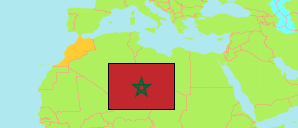
Souss - Massa
Region in Morocco
Contents: Subdivision
The population development in Souss - Massa as well as related information and services (Wikipedia, Google, images).
| Name | Status | Native | Population Census 1994-09-02 | Population Census 2004-09-02 | Population Census 2014-09-01 | Population Projection 2023-07-01 | |
|---|---|---|---|---|---|---|---|
| Souss - Massa | Region | سوس - ماسة | 1,926,288 | 2,324,142 | 2,676,847 | 3,018,226 | |
| Agadir - Ida - Outanane | Prefecture | أكادير إدا وتنان | 366,193 | 487,954 | 600,599 | 726,733 | → |
| Chtouka - Aït Baha | Province | شتوكة آيت باها | 240,092 | 297,245 | 371,102 | 445,898 | → |
| Inezgane - Aït Melloul | Prefecture | إنزكان ايت ملول | 292,571 | 419,614 | 541,118 | 675,081 | → |
| Taroudant | Province | تارودانت | 693,968 | 780,661 | 838,820 | 859,427 | → |
| Tata | Province | طاطا | 119,298 | 121,618 | 117,841 | 110,652 | → |
| Tiznit | Province | تيزنيت | 214,166 | 217,050 | 207,367 | 200,435 | → |
| Al-Maghrib [Morocco] | Kingdom | المغرب | 25,821,571 | 29,475,763 | 33,337,529 | 36,403,782 |
Source: Haut Commissariat au Plan, Royaume du Maroc.
Explanation: Some population changes between 2004 and 2014 are due to boundary changes.
Further information about the population structure:
| Gender (C 2014) | |
|---|---|
| Males | 1,300,313 |
| Females | 1,357,593 |
| Age Groups (C 2014) | |
|---|---|
| 0-14 years | 750,464 |
| 15-64 years | 1,735,610 |
| 65+ years | 171,831 |
| Age Distribution (C 2014) | |
|---|---|
| 70+ years | 117,789 |
| 60-69 years | 140,021 |
| 50-59 years | 234,772 |
| 40-49 years | 328,815 |
| 30-39 years | 405,165 |
| 20-29 years | 450,550 |
| 10-19 years | 472,024 |
| 0-9 years | 508,769 |
| Urbanization (C 2014) | |
|---|---|
| Rural | 1,164,708 |
| Urban | 1,493,198 |
| Citizenship (C 2014) | |
|---|---|
| Morocco | 2,671,933 |
| Foreign Citizenship | 4,914 |
| Literacy (A10+) (C 2014) | |
|---|---|
| yes | 1,945,758 |
| no | 712,148 |