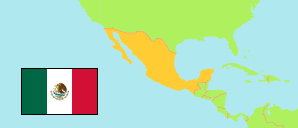
Tapalapa
Municipality in Chiapas
Municipality
The population development of Tapalapa.
| Name | Status | Population Census 2000-02-14 | Population Census 2005-10-17 | Population Census 2010-05-31 | Population Census 2020-03-15 | |
|---|---|---|---|---|---|---|
| Tapalapa | Municipality | 3,639 | 3,928 | 4,121 | 4,547 | → |
| Chiapas | State | 3,920,892 | 4,293,459 | 4,796,580 | 5,543,828 |
Contents: Localities
The population development of the localities in Tapalapa.
| Name | Status | Municipality | Population Census 2000-02-14 | Population Census 2005-10-17 | Population Census 2010-05-31 | Population Census 2020-03-15 | |
|---|---|---|---|---|---|---|---|
| Mazono | Rural Locality | Tapalapa | 355 | 395 | 410 | 426 | → |
| Tapalapa | Main Locality | Tapalapa | 1,652 | 1,866 | 1,940 | 2,272 | → |
Source: Instituto Nacional de Estadística Geografía e Informática, México (web).
Explanation: The tabulated population figures take into account amalgamations of localities.