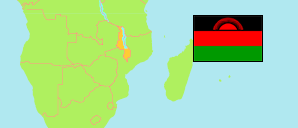
Blantyre
District in Malawi
Contents: Subdivision
The population in Blantyre as well as related information and services (Wikipedia, Google, images).
| Name | Status | Population Census 2018-09-03 | |
|---|---|---|---|
| Blantyre | District | 451,220 | |
| Chigaru | Traditional Authority | 51,779 | → |
| Kapeni | Traditional Authority | 103,742 | → |
| Kuntaja | Traditional Authority | 84,765 | → |
| Kunthembwe | Traditional Authority | 45,972 | → |
| Lundu | Traditional Authority | 32,271 | → |
| Machinjiri | Traditional Authority | 29,991 | → |
| Makata | Traditional Authority | 20,032 | → |
| Somba | Traditional Authority | 82,668 | → |
| Malawi | Republic | 17,563,749 |
Source: National Statistical Office of Malawi.
Further information about the population structure:
| Age Groups (C 2018) | |
|---|---|
| 0-14 years | 188,915 |
| 15-64 years | 243,371 |
| 65+ years | 18,934 |
| Age Distribution (C 2018) | |
|---|---|
| 0-9 years | 124,079 |
| 10-19 years | 119,291 |
| 20-29 years | 74,856 |
| 30-39 years | 54,562 |
| 40-49 years | 34,625 |
| 50-59 years | 18,333 |
| 60-69 years | 14,002 |
| 70+ years | 11,472 |