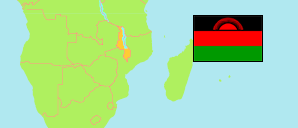
Southern
Region in Malawi
Contents: Subdivision
The population development in Southern as well as related information and services (Wikipedia, Google, images).
| Name | Status | Population Census 1977-09-20 | Population Census 1987-09-01 | Population Census 1998-09-01 | Population Census 2008-06-08 | Population Census 2018-09-03 | Population Projection 2023-09-03 | |
|---|---|---|---|---|---|---|---|---|
| Southern | Region | 2,754,891 | 3,965,734 | 4,633,968 | 5,852,755 | 7,750,629 | 8,743,362 | |
| Balaka | District | 146,587 | 213,416 | 253,098 | 316,574 | 438,379 | 504,349 | → |
| Blantyre | District | 189,051 | 256,405 | 307,344 | 339,406 | 451,220 | 509,289 | → |
| Blantyre City | City | 219,011 | 333,120 | 502,053 | 648,852 | 800,264 | 871,776 | → |
| Chikwawa | District | 194,425 | 316,733 | 356,682 | 437,892 | 564,684 | 628,282 | → |
| Chiradzulu | District | 176,184 | 210,912 | 236,050 | 287,604 | 356,875 | 389,928 | → |
| Machinga | District | 195,249 | 301,849 | 369,614 | 494,835 | 735,438 | 874,337 | → |
| Mangochi | District | 302,341 | 496,578 | 610,239 | 796,036 | 1,148,611 | 1,346,740 | → |
| Mulanje | District | 307,804 | 419,928 | 428,322 | 523,949 | 684,107 | 765,623 | → |
| Mwanza | District | ... | 60,300 | 63,200 | 92,237 | 130,949 | 152,433 | → |
| Neno | District | ... | 61,200 | 74,800 | 108,339 | 138,291 | 153,132 | → |
| Nsanje | District | 108,758 | 204,374 | 194,924 | 241,107 | 299,168 | 326,874 | → |
| Phalombe | District | 169,742 | 218,134 | 231,990 | 315,185 | 429,450 | 490,345 | → |
| Thyolo | District | 322,000 | 431,157 | 458,976 | 590,472 | 721,456 | 782,442 | → |
| Zomba | District | 328,100 | 398,365 | 480,746 | 578,766 | 746,724 | 831,015 | → |
| Zomba City | City | 24,234 | 43,250 | 65,915 | 81,501 | 105,013 | 116,797 | → |
| Malawi | Republic | 5,547,460 | 7,988,507 | 9,933,868 | 13,029,498 | 17,563,749 | 19,809,511 |
Source: National Statistical Office of Malawi.
Explanation: Population figures until 1998 are de facto, later figures are de jure.
Further information about the population structure:
| Gender (P 2023) | |
|---|---|
| Males | 4,204,446 |
| Females | 4,538,916 |
| Age Groups (P 2023) | |
|---|---|
| 0-14 years | 3,702,336 |
| 15-64 years | 4,730,190 |
| 65+ years | 310,837 |
| Age Distribution (P 2023) | |
|---|---|
| 0-9 years | 2,628,704 |
| 10-19 years | 2,055,938 |
| 20-29 years | 1,524,435 |
| 30-39 years | 1,021,733 |
| 40-49 years | 662,969 |
| 50-59 years | 404,694 |
| 60-69 years | 239,189 |
| 70-79 years | 136,760 |
| 80+ years | 68,941 |
| Urbanization (C 2018) | |
|---|---|
| Rural | 6,597,597 |
| Urban | 1,153,032 |
| Citizenship (C 2018) | |
|---|---|
| Malawi | 7,735,866 |
| Foreign Citizenship | 14,763 |
| Country of Birth (C 2018) | |
|---|---|
| Malawi | 7,697,839 |
| Other Country | 52,790 |
| Religion (C 2018) | |
|---|---|
| Christian | 5,448,774 |
| Muslim | 1,878,983 |
| Traditional | 19,202 |
| Other religion | 327,774 |
| No religion | 75,896 |
| Literacy (A5+) (C 2018) | |
|---|---|
| yes | 4,428,915 |
| no | 2,177,582 |
| Tribe (C 2018) | |
|---|---|
| Chewa | 511,299 |
| Tumbuka | 66,968 |
| Lomwe | 3,043,350 |
| Yao | 1,927,920 |
| Ngoni | 638,551 |
| Sena | 630,788 |
| Mang'anja | 526,381 |
| Other Tribe | 390,609 |