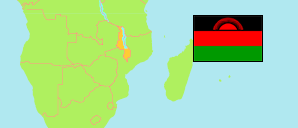
Balaka
District in Malawi
Contents: Population
The population development of Balaka as well as related information and services (Wikipedia, Google, images).
| Name | Status | Population Census 1977-09-20 | Population Census 1987-09-01 | Population Census 1998-09-01 | Population Census 2008-06-08 | Population Census 2018-09-03 | Population Projection 2023-09-03 | |
|---|---|---|---|---|---|---|---|---|
| Balaka | District | 146,587 | 213,416 | 253,098 | 316,574 | 438,379 | 504,349 | |
| Malawi | Republic | 5,547,460 | 7,988,507 | 9,933,868 | 13,029,498 | 17,563,749 | 19,809,511 |
Source: National Statistical Office of Malawi.
Explanation: Population figures until 1998 are de facto, later figures are de jure.
Further information about the population structure:
| Gender (P 2023) | |
|---|---|
| Males | 240,708 |
| Females | 263,641 |
| Age Groups (P 2023) | |
|---|---|
| 0-14 years | 221,293 |
| 15-64 years | 263,283 |
| 65+ years | 19,774 |
| Age Distribution (P 2023) | |
|---|---|
| 0-9 years | 156,463 |
| 10-19 years | 122,525 |
| 20-29 years | 81,967 |
| 30-39 years | 54,766 |
| 40-49 years | 36,464 |
| 50-59 years | 23,928 |
| 60-69 years | 15,237 |
| 70-79 years | 8,524 |
| 80+ years | 4,476 |
| Urbanization (C 2018) | |
|---|---|
| Rural | 389,024 |
| Urban | 49,355 |
| Citizenship (C 2018) | |
|---|---|
| Malawi | 437,835 |
| Foreign Citizenship | 544 |
| Country of Birth (C 2018) | |
|---|---|
| Malawi | 435,428 |
| Other Country | 2,951 |
| Religion (C 2018) | |
|---|---|
| Christians | 270,509 |
| Muslims | 152,298 |
| Traditional Religion | 641 |
| Other religion | 12,857 |
| No religion | 2,074 |
| Literacy (A5+) (C 2018) | |
|---|---|
| yes | 262,325 |
| no | 109,769 |
| Tribe (C 2018) | |
|---|---|
| Chewa | 21,860 |
| Tumbuka | 2,498 |
| Lomwe | 110,220 |
| Yao | 162,757 |
| Ngoni | 105,834 |
| Sena | 10,403 |
| Mang'anja | 9,215 |
| Other Tribe | 15,048 |
