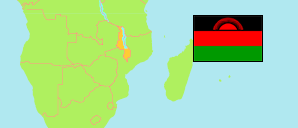
Zomba
District in Malawi
Contents: Subdivision
The population in Zomba as well as related information and services (Wikipedia, Google, images).
| Name | Status | Population Census 2018-09-03 | |
|---|---|---|---|
| Zomba | District | 746,724 | |
| Chikowi | Traditional Authority | 63,831 | → |
| Kuntumanji | Traditional Authority | 48,079 | → |
| Malemia | Traditional Authority | 82,320 | → |
| Mbiza | Traditional Authority | 85,311 | → |
| Mkumbira | Traditional Authority | 6,211 | → |
| Mlumbe | Traditional Authority | 127,300 | → |
| Mwambo | Traditional Authority | 151,997 | → |
| Ngwelero | Senior Traditional Authority | 34,034 | → |
| Nkagula | Senior Traditional Authority | 51,548 | → |
| Nkapita | Senior Traditional Authority | 45,355 | → |
| Ntholowa | Senior Traditional Authority | 50,738 | → |
| Malawi | Republic | 17,563,749 |
Source: National Statistical Office of Malawi.
Further information about the population structure:
| Age Groups (C 2018) | |
|---|---|
| 0-14 years | 335,765 |
| 15-64 years | 377,535 |
| 65+ years | 33,424 |
| Age Distribution (C 2018) | |
|---|---|
| 0-9 years | 223,187 |
| 10-19 years | 199,748 |
| 20-29 years | 113,051 |
| 30-39 years | 85,214 |
| 40-49 years | 51,748 |
| 50-59 years | 29,445 |
| 60-69 years | 23,971 |
| 70+ years | 20,360 |