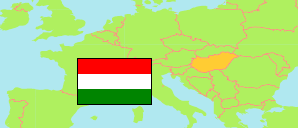
Nyírbátor
District in Szabolcs-Szatmár-Bereg
District
The population development of Nyírbátor.
| Name | Status | Population Census 1980-01-01 | Population Census 1990-01-01 | Population Census 2001-02-01 | Population Census 2011-10-01 | Population Census 2022-10-01 | |
|---|---|---|---|---|---|---|---|
| Nyírbátor | District | 47,355 | 44,881 | 45,207 | 43,040 | 39,865 | → |
| Szabolcs-Szatmár-Bereg | County | 593,829 | 572,301 | 582,256 | 559,272 | 529,381 |
Contents: Towns and Villages
The population development of the towns and villages in Nyírbátor.
| Name | Status | District | Population Census 1980-01-01 | Population Census 1990-01-01 | Population Census 2001-02-01 | Population Census 2011-10-01 | Population Census 2022-10-01 | |
|---|---|---|---|---|---|---|---|---|
| Bátorliget | Village | Nyírbátor | 997 | 825 | 788 | 662 | 581 | → |
| Encsencs | Village | Nyírbátor | 2,135 | 1,985 | 2,053 | 1,934 | 1,821 | → |
| Kisléta | Village | Nyírbátor | 1,762 | 1,726 | 1,903 | 1,849 | 1,609 | → |
| Máriapócs | Town | Nyírbátor | 2,287 | 2,224 | 2,153 | 2,085 | 1,887 | → |
| Nyírbátor | Town | Nyírbátor | 13,371 | 13,849 | 13,433 | 12,719 | 11,494 | → |
| Nyírbéltek | Large Village | Nyírbátor | 2,887 | 2,915 | 2,967 | 2,947 | 2,801 | → |
| Nyírbogát | Large Village | Nyírbátor | 3,555 | 3,221 | 3,284 | 3,098 | 2,917 | → |
| Nyírcsászári | Village | Nyírbátor | 1,190 | 1,152 | 1,218 | 1,136 | 1,064 | → |
| Nyírderzs | Village | Nyírbátor | 743 | 659 | 664 | 624 | 511 | → |
| Nyírgelse | Village | Nyírbátor | 1,391 | 1,157 | 1,158 | 1,113 | 1,051 | → |
| Nyírgyulaj | Village | Nyírbátor | 2,300 | 2,018 | 2,073 | 2,003 | 1,842 | → |
| Nyírlugos | Town | Nyírbátor | 3,371 | 3,007 | 3,006 | 2,789 | 2,491 | → |
| Nyírmihálydi | Village | Nyírbátor | 1,890 | 1,774 | 1,979 | 2,142 | 2,104 | → |
| Nyírpilis | Village | Nyírbátor | 700 | 634 | 685 | 812 | 724 | → |
| Nyírvasvári | Village | Nyírbátor | 2,008 | 1,770 | 1,960 | 1,884 | 1,824 | → |
| Ömböly | Village | Nyírbátor | 614 | 468 | 456 | 378 | 312 | → |
| Penészlek | Village | Nyírbátor | 1,430 | 1,158 | 1,068 | 874 | 945 | → |
| Piricse | Village | Nyírbátor | 1,838 | 1,805 | 1,835 | 1,777 | 1,817 | → |
| Pócspetri | Village | Nyírbátor | 1,990 | 1,791 | 1,826 | 1,616 | 1,496 | → |
| Terem | Village | Nyírbátor | 896 | 743 | 698 | 598 | 574 | → |
Source: Hungarian Central Statistical Office.
Explanation: 2022 census results are final.