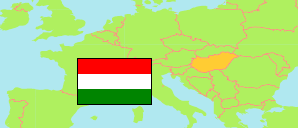
Mór
District in Fejér
District
The population development of Mór.
| Name | Status | Population Census 1980-01-01 | Population Census 1990-01-01 | Population Census 2001-02-01 | Population Census 2011-10-01 | Population Census 2022-10-01 | |
|---|---|---|---|---|---|---|---|
| Mór | District | 34,210 | 34,207 | 34,781 | 34,626 | 33,762 | → |
| Fejér | County | 420,317 | 418,852 | 434,317 | 425,847 | 419,656 |
Contents: Towns and Villages
The population development of the towns and villages in Mór.
| Name | Status | District | Population Census 1980-01-01 | Population Census 1990-01-01 | Population Census 2001-02-01 | Population Census 2011-10-01 | Population Census 2022-10-01 | |
|---|---|---|---|---|---|---|---|---|
| Bakonycsernye | Village | Mór | 3,391 | 3,156 | 3,189 | 3,053 | 2,940 | → |
| Balinka | Village | Mór | 1,226 | 1,000 | 947 | 925 | 895 | → |
| Bodajk | Town | Mór | 3,791 | 3,831 | 4,047 | 4,219 | 3,920 | → |
| Csákberény | Village | Mór | 1,313 | 1,244 | 1,225 | 1,201 | 1,153 | → |
| Csókakő | Village | Mór | 1,031 | 998 | 1,045 | 1,326 | 1,578 | → |
| Fehérvárcsurgó | Village | Mór | 1,918 | 1,811 | 1,886 | 1,947 | 2,070 | → |
| Isztimér | Village | Mór | 1,001 | 920 | 978 | 990 | 899 | → |
| Kincsesbánya | Village | Mór | 1,719 | 1,610 | 1,569 | 1,556 | 1,544 | → |
| Magyaralmás | Village | Mór | 1,379 | 1,416 | 1,537 | 1,556 | 1,629 | → |
| Mór | Town | Mór | 13,620 | 14,838 | 14,728 | 14,272 | 13,518 | → |
| Nagyveleg | Village | Mór | 751 | 632 | 699 | 640 | 611 | → |
| Pusztavám | Village | Mór | 2,657 | 2,352 | 2,499 | 2,441 | 2,459 | → |
| Söréd | Village | Mór | 413 | 399 | 432 | 500 | 546 | → |
Source: Hungarian Central Statistical Office.
Explanation: 2022 census results are final.