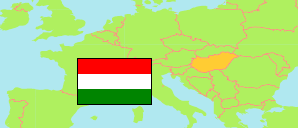
Makó
District in Csongrád-Csanád
District
The population development of Makó.
| Name | Status | Population Census 1980-01-01 | Population Census 1990-01-01 | Population Census 2001-02-01 | Population Census 2011-10-01 | Population Census 2022-10-01 | |
|---|---|---|---|---|---|---|---|
| Makó | District | 57,211 | 52,284 | 49,065 | 45,138 | 41,428 | → |
| Csongrád-Csanád | County | 456,300 | 438,842 | 433,344 | 417,456 | 391,184 |
Contents: Towns and Villages
The population development of the towns and villages in Makó.
| Name | Status | District | Population Census 1980-01-01 | Population Census 1990-01-01 | Population Census 2001-02-01 | Population Census 2011-10-01 | Population Census 2022-10-01 | |
|---|---|---|---|---|---|---|---|---|
| Ambrózfalva | Village | Makó | 581 | 555 | 525 | 496 | 435 | → |
| Apátfalva | Village | Makó | 4,361 | 3,704 | 3,287 | 3,040 | 2,828 | → |
| Csanádalberti | Village | Makó | 606 | 528 | 475 | 447 | 447 | → |
| Csanádpalota | Town | Makó | 4,040 | 3,549 | 3,235 | 2,923 | 2,546 | → |
| Földeák | Village | Makó | 3,721 | 3,489 | 3,327 | 3,099 | 2,899 | → |
| Királyhegyes | Village | Makó | 902 | 793 | 734 | 665 | 598 | → |
| Kiszombor | Large Village | Makó | 4,561 | 4,296 | 4,172 | 3,935 | 3,655 | → |
| Kövegy | Village | Makó | 584 | 476 | 467 | 377 | 316 | → |
| Magyarcsanád | Village | Makó | 1,931 | 1,705 | 1,646 | 1,488 | 1,280 | → |
| Makó | Town | Makó | 29,942 | 27,529 | 25,802 | 23,683 | 21,878 | → |
| Maroslele | Village | Makó | 2,213 | 2,183 | 2,182 | 2,117 | 2,045 | → |
| Nagyér | Village | Makó | 670 | 660 | 621 | 515 | 463 | → |
| Nagylak | Village | Makó | 798 | 708 | 597 | 488 | 380 | → |
| Óföldeák | Village | Makó | 616 | 534 | 495 | 456 | 465 | → |
| Pitvaros | Village | Makó | 1,685 | 1,575 | 1,500 | 1,409 | 1,193 | → |
Source: Hungarian Central Statistical Office.
Explanation: 2022 census results are final.