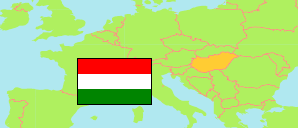
Vas
County in Hungary
Contents: Subdivision
The population development in Vas as well as related information and services (Wikipedia, Google, images).
| Name | Status | Population Census 1980-01-01 | Population Census 1990-01-01 | Population Census 2001-02-01 | Population Census 2011-10-01 | Population Census 2022-10-01 | Population Estimate 2025-01-01 | |
|---|---|---|---|---|---|---|---|---|
| Vas | County | 285,498 | 275,944 | 268,123 | 256,629 | 249,513 | 245,598 | |
| Celldömölk | District | 30,954 | 28,274 | 26,782 | 24,630 | 22,905 | 22,211 | → |
| Körmend | District | 31,515 | 29,541 | 29,267 | 27,177 | 25,269 | 24,572 | → |
| Kőszeg | District | 26,481 | 25,238 | 25,381 | 25,090 | 24,909 | 25,594 | → |
| Sárvár | District | 45,608 | 42,945 | 40,987 | 38,684 | 37,867 | 36,962 | → |
| Szentgotthárd | District | 17,123 | 16,094 | 16,063 | 14,961 | 14,273 | 13,742 | → |
| Szombathely | District | 114,992 | 117,306 | 114,335 | 112,320 | 111,259 | 109,758 | → |
| Vasvár | District | 18,825 | 16,546 | 15,308 | 13,767 | 13,031 | 12,759 | → |
| Magyarország [Hungary] | Country | 10,709,463 | 10,374,823 | 10,198,315 | 9,937,628 | 9,603,634 | 9,539,502 |
Source: Hungarian Central Statistical Office.
Explanation: 2022 census results are final.
Further information about the population structure:
| Gender (E 2025) | |
|---|---|
| Males | 119,273 |
| Females | 126,325 |
| Age Groups (E 2025) | |
|---|---|
| 0-14 years | 32,946 |
| 15-64 years | 158,462 |
| 65+ years | 54,190 |
| Age Distribution (E 2025) | |
|---|---|
| 80+ years | 11,722 |
| 70-79 years | 25,931 |
| 60-69 years | 31,605 |
| 50-59 years | 37,788 |
| 40-49 years | 38,954 |
| 30-39 years | 30,642 |
| 20-29 years | 24,126 |
| 10-19 years | 22,665 |
| 0-9 years | 22,165 |