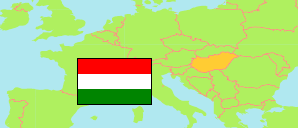
Szombathely
District in Hungary
Contents: Population
The population development of Szombathely as well as related information and services (Wikipedia, Google, images).
| Name | Status | Population Census 1980-01-01 | Population Census 1990-01-01 | Population Census 2001-02-01 | Population Census 2011-10-01 | Population Census 2022-10-01 | |||||||||||||
|---|---|---|---|---|---|---|---|---|---|---|---|---|---|---|---|---|---|---|---|
| Szombathely | District | 114,992 | 117,306 | 114,335 | 112,320 | 111,259 | |||||||||||||
Szombathely 111,259 Population [2022] – Census 646.4 km² Area 172.1/km² Population Density [2022] -0.090% Annual Population Change [2011 → 2022] | |||||||||||||||||||
| Magyarország [Hungary] | Country | 10,709,463 | 10,374,823 | 10,198,315 | 9,937,628 | 9,603,634 | |||||||||||||
Source: Hungarian Central Statistical Office.
Explanation: 2022 census results are final.
Further information about the population structure:
| Gender (C 2022) | |
|---|---|
| Males | 53,835 |
| Females | 57,424 |
| Age Groups (C 2022) | |
|---|---|
| 0-17 years | 18,357 |
| 18-64 years | 69,594 |
| 65+ years | 23,308 |
| Age Distribution (C 2022) | |
|---|---|
| 90+ years | 624 |
| 80-89 years | 4,295 |
| 70-79 years | 10,801 |
| 60-69 years | 14,043 |
| 50-59 years | 15,330 |
| 40-49 years | 19,668 |
| 30-39 years | 14,023 |
| 20-29 years | 11,910 |
| 10-19 years | 10,500 |
| 0-9 years | 10,065 |
