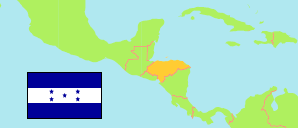
San Juan
Municipality in Honduras
Contents: Population
The population development of San Juan as well as related information and services (Wikipedia, Google, images).
| Name | Status | Population Census 2001-07-28 | Population Census 2013-08-10 | Population Projection 2023-07-01 | |
|---|---|---|---|---|---|
| San Juan | Municipality | 2,110 | 2,447 | 2,759 | |
| Honduras | Republic | 6,535,344 | 8,303,771 | 9,745,149 |
Source: Instituto Nacional de Estadística Honduras (web).
Explanation: All population figures are adjusted for underenumeration.
Further information about the population structure:
| Gender (P 2023) | |
|---|---|
| Males | 1,408 |
| Females | 1,351 |
| Age Groups (P 2023) | |
|---|---|
| 0-14 years | 874 |
| 15-64 years | 1,630 |
| 65+ years | 255 |
| Age Distribution (P 2023) | |
|---|---|
| 80+ years | 63 |
| 70-79 years | 126 |
| 60-69 years | 134 |
| 50-59 years | 181 |
| 40-49 years | 277 |
| 30-39 years | 347 |
| 20-29 years | 480 |
| 10-19 years | 555 |
| 0-9 years | 596 |
| Urbanization (P 2023) | |
|---|---|
| Rural | 2,759 |
| Place of Birth (C 2013) | |
|---|---|
| Same municipality | 2,253 |
| Other municipality in Honduras | 186 |
| Other country | 8 |
| Ethnic Group (C 2013) | |
|---|---|
| Indigenous | 6 |
| Non-Indigenous | 2,441 |