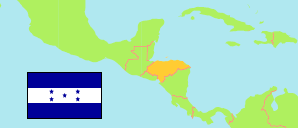
La Paz
Department in Honduras
Contents: Subdivision
The population development in La Paz as well as related information and services (Wikipedia, Google, images).
| Name | Status | Population Census 2001-07-28 | Population Census 2013-08-10 | Population Projection 2023-07-01 | |
|---|---|---|---|---|---|
| La Paz | Department | 156,560 | 198,926 | 235,599 | |
| Aguanqueterique | Municipality | 4,921 | 4,738 | 5,175 | → |
| Cabañas | Municipality | 2,427 | 3,253 | 4,122 | → |
| Cane | Municipality | 2,378 | 3,592 | 5,094 | → |
| Chinacla | Municipality | 6,157 | 7,836 | 9,135 | → |
| Guajiquiro | Municipality | 12,676 | 14,616 | 16,367 | → |
| La Paz | Municipality | 30,719 | 43,980 | 55,776 | → |
| Lauterique | Municipality | 2,989 | 2,986 | 3,199 | → |
| Marcala | Municipality | 21,595 | 28,614 | 34,965 | → |
| Mercedes de Oriente | Municipality | 1,110 | 1,087 | 1,221 | → |
| Opatoro | Municipality | 7,835 | 7,408 | 8,327 | → |
| San Antonio del Norte | Municipality | 3,020 | 2,725 | 3,060 | → |
| San José | Municipality | 7,666 | 8,928 | 9,320 | → |
| San Juan | Municipality | 2,110 | 2,447 | 2,759 | → |
| San Pedro de Tutule | Municipality | 5,483 | 6,939 | 8,287 | → |
| Santa Ana | Municipality | 9,857 | 11,777 | 13,580 | → |
| Santa Elena | Municipality | 7,227 | 12,162 | 14,380 | → |
| Santa María | Municipality | 8,478 | 10,812 | 12,378 | → |
| Santiago de Puringla | Municipality | 13,831 | 16,182 | 18,030 | → |
| Yarula | Municipality | 5,962 | 8,844 | 10,423 | → |
| Honduras | Republic | 6,535,344 | 8,303,771 | 9,745,149 |
Source: Instituto Nacional de Estadística Honduras (web).
Explanation: All population figures are adjusted for underenumeration.
Further information about the population structure:
| Gender (P 2023) | |
|---|---|
| Males | 114,641 |
| Females | 120,958 |
| Age Groups (P 2023) | |
|---|---|
| 0-14 years | 74,713 |
| 15-64 years | 147,337 |
| 65+ years | 13,549 |
| Age Distribution (P 2023) | |
|---|---|
| 80+ years | 2,928 |
| 70-79 years | 6,004 |
| 60-69 years | 10,415 |
| 50-59 years | 15,731 |
| 40-49 years | 23,301 |
| 30-39 years | 34,201 |
| 20-29 years | 44,027 |
| 10-19 years | 49,195 |
| 0-9 years | 49,797 |
| Urbanization (P 2023) | |
|---|---|
| Rural | 167,133 |
| Urban | 68,466 |
| Place of Birth (C 2013) | |
|---|---|
| Same municipality | 171,202 |
| Other municipality in Honduras | 26,882 |
| Other country | 843 |
| Ethnic Group (C 2013) | |
|---|---|
| Indigenous | 110,854 |
| Non-Indigenous | 88,072 |