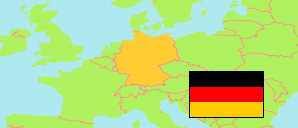
Böblingen
County in Baden-Württemberg
County
The population development of Böblingen.
| Name | Status | Population Estimate 1990-12-31 | Population Estimate 2001-12-31 | Population Census 2011-05-09 | Population Census 2022-05-15 | Population Estimate 2024-12-31 | |
|---|---|---|---|---|---|---|---|
| Böblingen | County | 334,602 | 367,830 | 363,950 | 389,650 | 395,167 | → |
| Baden-Württemberg | State | 9,822,027 | 10,600,906 | 10,486,660 | 11,104,040 | 11,245,898 |
Contents: Cities and Communes
The population development of the cities and communes in Böblingen.
| Name | Status | County | Population Estimate 1990-12-31 | Population Estimate 2001-12-31 | Population Census 2011-05-09 | Population Census 2022-05-15 | Population Estimate 2024-12-31 | |
|---|---|---|---|---|---|---|---|---|
| Aidlingen | Commune | Böblingen | 8,309 | 9,208 | 8,731 | 9,151 | 9,302 | → |
| Altdorf | Commune | Böblingen | 2,942 | 4,259 | 4,542 | 4,547 | 4,529 | → |
| Böblingen | City | Böblingen | 44,903 | 45,940 | 44,859 | 50,705 | 51,483 | → |
| Bondorf | Commune | Böblingen | 3,768 | 5,387 | 5,716 | 6,197 | 6,230 | → |
| Deckenpfronn | Commune | Böblingen | 2,231 | 2,785 | 3,208 | 3,269 | 3,274 | → |
| Ehningen | Commune | Böblingen | 7,209 | 7,543 | 7,820 | 9,124 | 9,277 | → |
| Gärtringen | Commune | Böblingen | 10,731 | 11,373 | 11,521 | 12,903 | 12,934 | → |
| Gäufelden | Commune | Böblingen | 7,110 | 9,256 | 9,096 | 8,982 | 9,181 | → |
| Grafenau | Commune | Böblingen | 5,564 | 6,623 | 6,401 | 6,670 | 6,578 | → |
| Herrenberg | City | Böblingen | 27,344 | 30,626 | 29,939 | 33,344 | 34,192 | → |
| Hildrizhausen | Commune | Böblingen | 3,061 | 3,486 | 3,527 | 3,493 | 3,581 | → |
| Holzgerlingen | City | Böblingen | 9,847 | 11,463 | 12,156 | 13,822 | 14,184 | → |
| Jettingen | Commune | Böblingen | 5,907 | 7,516 | 7,457 | 7,981 | 8,012 | → |
| Leonberg | City | Böblingen | 42,654 | 44,904 | 44,630 | 48,337 | 49,480 | → |
| Magstadt | Commune | Böblingen | 8,233 | 8,953 | 8,908 | 9,580 | 9,513 | → |
| Mötzingen | Commune | Böblingen | 2,979 | 3,546 | 3,610 | 3,711 | 3,719 | → |
| Nufringen | Commune | Böblingen | 4,232 | 4,911 | 5,392 | 5,753 | 5,806 | → |
| Renningen | City | Böblingen | 14,580 | 17,420 | 16,720 | 18,443 | 18,567 | → |
| Rutesheim | City | Böblingen | 9,025 | 10,101 | 9,764 | 10,936 | 11,258 | → |
| Schönaich | Commune | Böblingen | 9,706 | 10,160 | 9,605 | 10,339 | 10,495 | → |
| Sindelfingen | City | Böblingen | 58,805 | 60,878 | 60,534 | 60,545 | 61,422 | → |
| Steinenbronn | Commune | Böblingen | 5,108 | 6,011 | 6,033 | 6,433 | 6,332 | → |
| Waldenbuch | City | Böblingen | 7,787 | 8,821 | 8,392 | 8,630 | 8,750 | → |
| Weil der Stadt | City | Böblingen | 17,266 | 19,113 | 18,313 | 19,411 | 19,353 | → |
| Weil im Schönbuch | Commune | Böblingen | 8,773 | 9,895 | 9,711 | 9,720 | 9,970 | → |
| Weissach | Commune | Böblingen | 6,528 | 7,652 | 7,365 | 7,624 | 7,745 | → |
Source: Statistisches Bundesamt Deutschland, Statistical Offices of the German States.
Explanation: Communes and counties within the boundaries of 31 December 2024. For privacy reasons, the statistical office skewed the 2022 census numbers by small amounts. To avoid inconsistencies and negative values, further adjustments are applied here.