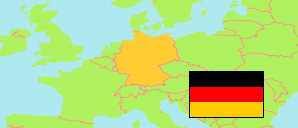
Sachsen-Anhalt
State in Germany
Contents: Subdivision
The population development in Sachsen-Anhalt as well as related information and services (Wikipedia, Google, images).
| Name | Status | Population Estimate 1990-12-31 | Population Estimate 2001-12-31 | Population Census 2011-05-09 | Population Census 2022-05-15 | |
|---|---|---|---|---|---|---|
| Sachsen-Anhalt [Saxony-Anhalt] | State | 2,873,957 | 2,580,626 | 2,287,040 | 2,146,443 | |
| Altmarkkreis Salzwedel | County | 105,018 | 100,428 | 88,241 | 81,159 | → |
| Anhalt-Bitterfeld | County | 228,920 | 203,642 | 172,127 | 154,059 | → |
| Börde | County | 191,598 | 196,566 | 176,048 | 168,411 | → |
| Burgenlandkreis | County | 244,426 | 218,945 | 189,729 | 174,746 | → |
| Dessau-Roßlau | County-level City | 114,130 | 97,627 | 86,030 | 75,938 | → |
| Halle (Saale) | County-level City | 310,234 | 243,045 | 229,153 | 226,586 | → |
| Harz | County | 283,440 | 258,228 | 226,495 | 207,617 | → |
| Jerichower Land | County | 107,578 | 107,455 | 93,849 | 88,710 | → |
| Magdeburg | County-level City | 280,536 | 229,755 | 228,144 | 241,517 | → |
| Mansfeld-Südharz | County | 197,600 | 173,631 | 147,887 | 131,514 | → |
| Saalekreis | County | 208,644 | 215,917 | 191,681 | 181,788 | → |
| Salzlandkreis | County | 273,071 | 241,274 | 205,458 | 184,199 | → |
| Stendal | County | 156,157 | 138,553 | 119,204 | 107,250 | → |
| Wittenberg | County | 172,605 | 155,560 | 132,994 | 122,949 | → |
| Deutschland [Germany] | Federal Republic | 79,753,227 | 82,440,309 | 80,219,695 | 82,711,282 |
Source: Statistisches Bundesamt Deutschland, Statistical Offices of the German States.
Explanation: States and counties in the boundaries of 31 December 2022. For privacy reasons, the statistical office skewed the 2022 census numbers by small amounts. To avoid inconsistencies and negative values, further adjustments are applied here. The 2022 total population of Germany exclude 8,258 persons posted abroad.
Further information about the population structure:
| Gender (C 2022) | |
|---|---|
| Males | 1,049,819 |
| Females | 1,096,624 |
| Age Groups (C 2022) | |
|---|---|
| 0-17 years | 321,216 |
| 18-64 years | 1,227,833 |
| 65+ years | 597,394 |
| Age Distribution (C 2022) | |
|---|---|
| 90+ years | 25,040 |
| 80-89 years | 170,833 |
| 70-79 years | 234,469 |
| 60-69 years | 348,470 |
| 50-59 years | 343,981 |
| 40-49 years | 242,336 |
| 30-39 years | 259,127 |
| 20-29 years | 167,874 |
| 10-19 years | 179,428 |
| 0-9 years | 174,884 |
| Religion (C 2022) | |
|---|---|
| Roman Catholic | 64,841 |
| Protestant | 231,061 |
| Other/No/Unknown | 1,850,544 |
| Citizenship (C 2022) | |
|---|---|
| Germany | 2,022,846 |
| EU 27 (2020) | 33,675 |
| Other Citizenship | 89,922 |
| Citizenship (C 2022) | |
|---|---|
| German | 2,022,846 |
| Poland | 10,014 |
| Turkey | 3,098 |
| Romania | 8,061 |
| Ukraine | 17,133 |
| Syria | 22,268 |
| Italy | 1,199 |
| Other country | 61,824 |
| Region of Birth (C 2022) | |
|---|---|
| Germany | 1,975,421 |
| EU 27 (2020) | 63,232 |
| Other country | 107,790 |
| Country of Birth (C 2022) | |
|---|---|
| Germany | 1,975,421 |
| Poland | 25,244 |
| Turkey | 3,370 |
| Russia | 10,651 |
| Romania | 7,417 |
| Kazakhstan | 5,444 |
| Ukraine | 18,079 |
| Syria | 19,553 |
| Italy | 1,163 |
| Other country | 80,101 |