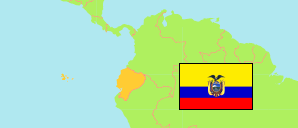
Los Ríos (Ecuador)
Province
The population development of Los Ríos.
| Name | Status | Population Census 1990-11-25 | Population Census 2001-11-25 | Population Census 2010-11-28 | Population Census 2022-10-01 | |
|---|---|---|---|---|---|---|
| Los Ríos (Mayukuna) | Province | 527,559 | 650,178 | 778,115 | 898,652 | → |
| Ecuador | Republic | 9,697,979 | 12,156,608 | 14,483,499 | 16,938,986 |
Contents: Urban Places
The population development of the urban places in Los Ríos.
| Name | Status | Province | Population Census 1990-11-25 | Population Census 2001-11-25 | Population Census 2010-11-28 | Population Census 2022-10-01 | |
|---|---|---|---|---|---|---|---|
| Baba | Urban Place | Los Ríos | 2,175 | 3,893 | 5,368 | 6,746 | → |
| Babahoyo | Urban Place | Los Ríos | 50,285 | 76,869 | 90,191 | 98,251 | → |
| Buena Fé (San Jacinto de Buena Fé) | Urban Place | Los Ríos | ... | 27,516 | 38,263 | 46,779 | → |
| Catarama (Katarama) | Urban Place | Los Ríos | 4,272 | 5,239 | 6,240 | 7,216 | → |
| Mocache (Mukachi) | Urban Place | Los Ríos | ... | 5,493 | 8,028 | 9,535 | → |
| Montalvo | Urban Place | Los Ríos | 7,120 | 9,427 | 12,734 | 16,248 | → |
| Palenque | Urban Place | Los Ríos | 3,084 | 4,783 | 6,348 | 7,258 | → |
| Puebloviejo | Urban Place | Los Ríos | 4,799 | 6,735 | 7,871 | 9,646 | → |
| Quevedo | Urban Place | Los Ríos | 86,910 | 120,379 | 150,827 | 177,792 | → |
| Quinsaloma (Kimsaluma) | Urban Place | Los Ríos | ... | ... | 4,573 | 6,161 | → |
| Valencia | Urban Place | Los Ríos | ... | 9,235 | 16,983 | 22,996 | → |
| Ventanas | Urban Place | Los Ríos | 23,217 | 32,425 | 38,168 | 41,531 | → |
| Vinces | Urban Place | Los Ríos | 17,512 | 24,128 | 30,248 | 35,064 | → |
Source: Instituto Nacional de Estadística y Censos del Ecuador (web).
Explanation: Census figures are not adjusted for underenumeration. The urban population of the corresponding parish is tabulated.