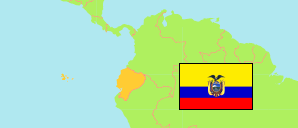
Los Ríos
Province in Ecuador
Contents: Subdivision
The population development in Los Ríos as well as related information and services (Wikipedia, Google, images).
| Name | Status | Population Census 1990-11-25 | Population Census 2001-11-25 | Population Census 2010-11-28 | Population Census 2022-11-30 | |
|---|---|---|---|---|---|---|
| Los Ríos (Mayukuna) | Province | 527,559 | 650,178 | 778,115 | 898,652 | |
| Baba | Canton | 29,406 | 35,185 | 39,681 | 45,296 | → |
| Babahoyo | Canton | 105,471 | 132,824 | 153,776 | 178,509 | → |
| Buena Fé | Canton | ... | 47,361 | 63,148 | 74,410 | → |
| Mocache (Mukachi) | Canton | ... | 33,481 | 38,392 | 42,026 | → |
| Montalvo | Canton | 19,023 | 20,067 | 24,164 | 28,354 | → |
| Palenque | Canton | 18,242 | 20,658 | 22,320 | 24,838 | → |
| Puebloviejo (Mawkallakta) | Canton | 22,662 | 29,420 | 36,477 | 40,961 | → |
| Quevedo | Canton | 196,568 | 139,790 | 173,575 | 206,008 | → |
| Quinsaloma (Kimsaluma) | Canton | ... | 13,150 | 16,476 | 19,470 | → |
| Urdaneta | Canton | 23,459 | 25,812 | 29,263 | 33,151 | → |
| Valencia | Canton | ... | 32,870 | 42,556 | 51,509 | → |
| Ventanas | Canton | 58,494 | 57,995 | 66,551 | 73,211 | → |
| Vinces | Canton | 54,234 | 61,565 | 71,736 | 80,909 | → |
| Ecuador | Republic | 9,697,979 | 12,156,608 | 14,483,499 | 16,938,986 |
Source: Instituto Nacional de Estadística y Censos del Ecuador.
Explanation: Census figures are not adjusted for underenumeration.
Further information about the population structure:
| Gender (C 2022) | |
|---|---|
| Males | 443,391 |
| Females | 455,261 |
| Age Groups (C 2022) | |
|---|---|
| 0-14 years | 251,713 |
| 15-64 years | 573,358 |
| 65+ years | 73,581 |
| Age Distribution (C 2022) | |
|---|---|
| 90+ years | 2,797 |
| 80-89 years | 13,296 |
| 70-79 years | 31,742 |
| 60-69 years | 57,679 |
| 50-59 years | 83,421 |
| 40-49 years | 105,083 |
| 30-39 years | 117,163 |
| 20-29 years | 150,703 |
| 10-19 years | 177,466 |
| 0-9 years | 159,302 |
| Urbanization (C 2022) | |
|---|---|
| Rural | 413,429 |
| Urban | 485,223 |
| Citizenship (C 2022) | |
|---|---|
| Ecuador | 890,982 |
| Other | 7,670 |
| Place of Birth (C 2022) | |
|---|---|
| Same parish | 599,428 |
| Other parish | 290,618 |
| Other country | 8,606 |
| Ethnic Group (C 2022) | |
|---|---|
| Indigenous | 5,960 |
| Afro-Ecuadorian | 20,831 |
| Montubios | 317,710 |
| Mestizos | 543,689 |
| White | 10,032 |
| Other Ethnic Group | 430 |
