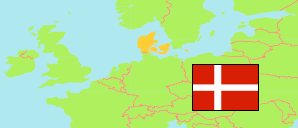
Nyborg
Municipality in Syddanmark
Municipality
The population development of Nyborg.
| Name | Status | Population Estimate 2006-01-01 | Population Estimate 2011-01-01 | Population Estimate 2016-01-01 | Population Estimate 2021-01-01 | Population Estimate 2025-01-01 | |
|---|---|---|---|---|---|---|---|
| Nyborg | Municipality | 31,208 | 31,499 | 31,886 | 31,933 | 32,329 | → |
| Syddanmark [South Denmark] | Region | 1,185,851 | 1,200,656 | 1,211,770 | 1,223,634 | 1,240,472 |
Contents: Urban Settlements
The population development of the urban settlements in Nyborg.
| Name | Status | Municipality | Population Estimate 2006-01-01 | Population Estimate 2011-01-01 | Population Estimate 2016-01-01 | Population Estimate 2021-01-01 | Population Estimate 2025-01-01 | |
|---|---|---|---|---|---|---|---|---|
| Aunslev | Urban Settlement | Nyborg | 423 | 399 | 420 | 398 | 387 | → |
| Ellinge | Urban Settlement | Nyborg | 229 | 235 | 241 | 229 | 224 | → |
| Frørup | Urban Settlement | Nyborg | 440 | 430 | 427 | 392 | 377 | → |
| Hjulby | Urban Settlement | Nyborg | 444 | 418 | 394 | 397 | 387 | → |
| Måre | Urban Settlement | Nyborg | 499 | 590 | 594 | 562 | 521 | → |
| Nyborg | Urban Settlement | Nyborg | 16,043 | 16,492 | 17,008 | 17,415 | 17,990 | → |
| Ørbæk | Urban Settlement | Nyborg | 1,540 | 1,533 | 1,596 | 1,660 | 1,752 | → |
| Refsvindinge | Urban Settlement | Nyborg | 568 | 576 | 570 | 561 | 566 | → |
| Skellerup | Urban Settlement | Nyborg | 372 | 374 | 352 | 334 | 351 | → |
| Svindinge | Urban Settlement | Nyborg | 292 | 294 | 293 | 303 | 284 | → |
| Tårup | Urban Settlement | Nyborg | 306 | 307 | 296 | 294 | 283 | → |
| Ullerslev | Urban Settlement | Nyborg | 2,722 | 2,772 | 2,770 | 2,685 | 2,714 | → |
| Vindinge | Urban Settlement | Nyborg | 426 | 428 | 434 | 453 | 474 | → |
Source: Denmark Statistik.
