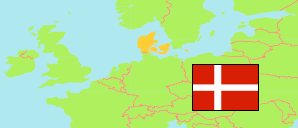
Middelfart
Municipality in Syddanmark
Municipality
The population development of Middelfart.
| Name | Status | Population Estimate 2006-01-01 | Population Estimate 2011-01-01 | Population Estimate 2016-01-01 | Population Estimate 2021-01-01 | Population Estimate 2025-01-01 | |
|---|---|---|---|---|---|---|---|
| Middelfart | Municipality | 36,417 | 37,701 | 37,913 | 39,116 | 40,318 | → |
| Syddanmark [South Denmark] | Region | 1,185,851 | 1,200,656 | 1,211,770 | 1,223,634 | 1,240,472 |
Contents: Urban Settlements
The population development of the urban settlements in Middelfart.
| Name | Status | Municipality | Population Estimate 2006-01-01 | Population Estimate 2011-01-01 | Population Estimate 2016-01-01 | Population Estimate 2021-01-01 | Population Estimate 2025-01-01 | |
|---|---|---|---|---|---|---|---|---|
| Båring | Urban Settlement | Middelfart | 846 | 945 | 952 | 930 | 970 | → |
| Brenderup | Urban Settlement | Middelfart | 1,324 | 1,366 | 1,423 | 1,399 | 1,486 | → |
| Ejby | Urban Settlement | Middelfart | 1,962 | 1,978 | 1,978 | 2,153 | 2,154 | → |
| Fjelsted | Urban Settlement | Middelfart | 316 | 303 | 295 | 305 | 306 | → |
| Gelsted | Urban Settlement | Middelfart / Assens | 1,651 | 1,684 | 1,705 | 1,728 | 1,713 | → |
| Harndrup | Urban Settlement | Middelfart | 619 | 652 | 638 | 616 | 605 | → |
| Kauslunde | Urban Settlement | Middelfart | 567 | 552 | 565 | 514 | 494 | → |
| Middelfart | Urban Settlement | Middelfart | 13,645 | 14,781 | 15,044 | 15,986 | 16,749 | → |
| Nørre Aaby | Urban Settlement | Middelfart | 2,786 | 2,877 | 2,926 | 2,979 | 3,196 | → |
| Røjle | Urban Settlement | Middelfart | 242 | 275 | 256 | 240 | 234 | → |
| Strib | Urban Settlement | Middelfart | 4,387 | 4,365 | 4,492 | 4,817 | 5,280 | → |
Source: Denmark Statistik.
