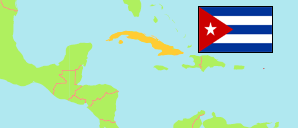
Mayabeque
Province in Cuba
Contents: Subdivision
The population development in Mayabeque as well as related information and services (Wikipedia, Google, images).
| Name | Status | Population Census 2002-09-06 | Population Census 2012-09-14 | Population Estimate 2022-12-31 | |
|---|---|---|---|---|---|
| Mayabeque | Province | 369,851 | 376,825 | 381,104 | |
| Batabanó | Municipality | 25,265 | 26,667 | 27,232 | → |
| Bejucal | Municipality | 24,899 | 26,879 | 28,205 | → |
| Güines | Municipality | 68,840 | 66,560 | 65,037 | → |
| Jaruco | Municipality | 25,611 | 24,673 | 24,162 | → |
| Madruga | Municipality | 30,560 | 28,262 | 26,412 | → |
| Melena del Sur | Municipality | 20,230 | 20,403 | 20,383 | → |
| Nueva Paz | Municipality | 23,792 | 25,377 | 23,002 | → |
| Quivicán | Municipality | 28,752 | 29,597 | 30,016 | → |
| San José de las Lajas | Municipality | 68,206 | 73,136 | 81,261 | → |
| San Nicolás (San Nicolás de Bari) | Municipality | 21,725 | 20,862 | 20,487 | → |
| Santa Cruz del Norte | Municipality | 31,971 | 34,409 | 34,907 | → |
| Cuba | Republic | 11,177,743 | 11,167,325 | 11,089,511 |
Source: Oficina Nacional de Estadísticas, Cuba.
Further information about the population structure:
| Gender (E 2022) | |
|---|---|
| Males | 192,299 |
| Females | 188,805 |
| Age Groups (E 2019) | |
|---|---|
| 0-14 years | 60,828 |
| 15-64 years | 264,498 |
| 65+ years | 58,543 |
| Age Distribution (E 2019) | |
|---|---|
| 0-9 years | 41,263 |
| 10-19 years | 41,748 |
| 20-29 years | 51,371 |
| 30-39 years | 50,517 |
| 40-49 years | 56,442 |
| 50-59 years | 64,311 |
| 60-69 years | 37,704 |
| 70-79 years | 27,376 |
| 80+ years | 13,137 |
| Urbanization (E 2022) | |
|---|---|
| Rural | 106,853 |
| Urban | 274,251 |
| Ethnic Group (C 2012) | |
|---|---|
| White | 294,414 |
| Black | 82,411 |
| Mestizo, Mulatto | 29,719 |