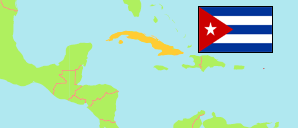
Quivicán
Municipality in Cuba
Contents: Population
The population development of Quivicán as well as related information and services (Wikipedia, Google, images).
| Name | Status | Population Census 2002-09-06 | Population Census 2012-09-14 | Population Estimate 2022-12-31 | |
|---|---|---|---|---|---|
| Quivicán | Municipality | 28,752 | 29,597 | 30,016 | |
| Cuba | Republic | 11,177,743 | 11,167,325 | 11,089,511 |
Source: Oficina Nacional de Estadísticas, Cuba.
Further information about the population structure:
| Gender (E 2022) | |
|---|---|
| Males | 15,252 |
| Females | 14,764 |
| Age Groups (E 2019) | |
|---|---|
| 0-14 years | 4,842 |
| 15-64 years | 20,782 |
| 65+ years | 4,435 |
| Age Distribution (E 2019) | |
|---|---|
| 0-9 years | 3,227 |
| 10-19 years | 3,358 |
| 20-29 years | 4,138 |
| 30-39 years | 4,019 |
| 40-49 years | 4,441 |
| 50-59 years | 4,877 |
| 60-69 years | 2,901 |
| 70-79 years | 2,103 |
| 80+ years | 995 |
| Urbanization (E 2022) | |
|---|---|
| Rural | 9,660 |
| Urban | 20,356 |
| Ethnic Group (C 2012) | |
|---|---|
| White | 23,855 |
| Black | 5,742 |
| Mestizo, Mulatto | 1,803 |