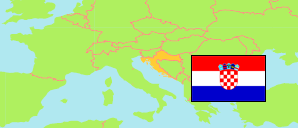
Kamanje
Municipality in Karlovac
Municipality
The population development of Kamanje.
| Name | Status | Population Census 2001-03-31 | Population Census 2011-03-31 | Population Census 2021-08-31 | |
|---|---|---|---|---|---|
| Kamanje | Municipality | 1,008 | 891 | 827 | → |
| Karlovac | County | 141,787 | 128,899 | 112,195 |
Contents: Settlements
The population development of the settlements in Kamanje.
| Name | Status | Municipality | Population Census 2001-03-31 | Population Census 2011-03-31 | Population Census 2021-08-31 | |
|---|---|---|---|---|---|---|
| Brlog Ozaljski | Settlement | Kamanje | 93 | 89 | 74 | → |
| Kamanje | Settlement | Kamanje | 423 | 366 | 366 | → |
| Mali Vrh Kamanjski | Settlement | Kamanje | 60 | 67 | 67 | → |
| Orljakovo | Settlement | Kamanje | 220 | 188 | 165 | → |
| Reštovo | Settlement | Kamanje | 112 | 104 | 101 | → |
Source: Croatian Bureau of Statistics (web).
Explanation: Area figures are computed by using geospatial data.