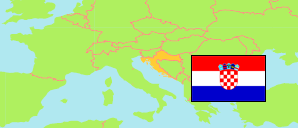
Vrpolje
Municipality in Brod-Posavina
Municipality
The population development of Vrpolje.
| Name | Status | Population Census 2001-03-31 | Population Census 2011-03-31 | Population Census 2021-08-31 | |
|---|---|---|---|---|---|
| Vrpolje | Municipality | 4,023 | 3,521 | 2,818 | → |
| Brod-Posavina | County | 176,765 | 158,575 | 130,267 |
Contents: Settlements
The population development of the settlements in Vrpolje.
| Name | Status | Municipality | Population Census 2001-03-31 | Population Census 2011-03-31 | Population Census 2021-08-31 | |
|---|---|---|---|---|---|---|
| Čajkovci | Settlement | Vrpolje | 735 | 639 | 494 | → |
| Stari Perkovci | Settlement | Vrpolje | 1,178 | 1,123 | 928 | → |
| Vrpolje | Settlement | Vrpolje | 2,110 | 1,759 | 1,396 | → |
Source: Croatian Bureau of Statistics (web).
Explanation: Area figures are computed by using geospatial data.