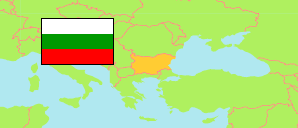
Sofija
Province in Bulgaria
Contents: Subdivision
The population development in Sofija as well as related information and services (Wikipedia, Google, images).
| Name | Status | Native | Population Census 2001-03-01 | Population Census 2011-02-01 | Population Census 2021-09-07 | Population Estimate 2024-12-31 | |
|---|---|---|---|---|---|---|---|
| Sofija [Sofia] | Province | София | 273,251 | 247,489 | 231,989 | 224,701 | |
| Anton | Municipality | Антон | 1,806 | 1,599 | 1,464 | 1,391 | → |
| Botevgrad | Municipality | Ботевград | 35,943 | 33,175 | 31,238 | 30,225 | → |
| Božurište [Bozhurishte] | Municipality | Божурище | 7,985 | 8,473 | 9,463 | 9,298 | → |
| Čavdar [Chavdar] | Municipality | Чавдар | 1,422 | 1,272 | 1,180 | 1,143 | → |
| Čelopeč [Chelopech] | Municipality | Челопеч | 1,710 | 1,473 | 1,456 | 1,445 | → |
| Dolna Banja [Dolna Banya] | Municipality | Долна баня | 4,787 | 4,522 | 4,248 | 4,229 | → |
| Dragoman | Municipality | Драгоман | 6,632 | 5,362 | 4,613 | 4,436 | → |
| Elin Pelin | Municipality | Елин Пелин | 24,072 | 22,841 | 23,104 | 22,841 | → |
| Etropole | Municipality | Етрополе | 13,734 | 12,047 | 10,888 | 10,445 | → |
| Godeč [Godech] | Municipality | Годеч | 6,604 | 5,375 | 4,927 | 4,726 | → |
| Gorna Malina | Municipality | Горна Малина | 7,062 | 6,209 | 6,175 | 6,258 | → |
| Ihtiman | Municipality | Ихтиман | 19,304 | 17,720 | 17,397 | 16,924 | → |
| Koprivštica [Koprivshtitsa] | Municipality | Копривщица | 2,669 | 2,410 | 1,957 | 1,889 | → |
| Kostenec [Kostenets] | Municipality | Костенец | 15,142 | 12,793 | 11,062 | 10,531 | → |
| Kostinbrod | Municipality | Костинброд | 18,015 | 17,846 | 17,824 | 17,430 | → |
| Mirkovo | Municipality | Мирково | 3,179 | 2,540 | 2,337 | 2,188 | → |
| Pirdop | Municipality | Пирдоп | 9,352 | 8,293 | 7,281 | 6,887 | → |
| Pravec [Pravets] | Municipality | Правец | 8,995 | 7,569 | 7,131 | 7,014 | → |
| Samokov | Municipality | Самоков | 42,315 | 38,089 | 34,864 | 33,703 | → |
| Slivnica [Slivnitsa] | Municipality | Сливница | 10,422 | 9,681 | 8,987 | 8,578 | → |
| Svoge | Municipality | Своге | 25,412 | 22,363 | 19,427 | 18,437 | → |
| Zlatica [Zlatitsa] | Municipality | Златица | 6,689 | 5,837 | 4,966 | 4,683 | → |
| Bǎlgarija [Bulgaria] | Republic | България | 7,932,984 | 7,364,570 | 6,519,789 | 6,437,360 |
Source: National Statistical Institute Bulgaria.
Further information about the population structure:
| Gender (E 2024) | |
|---|---|
| Males | 109,802 |
| Females | 114,899 |
| Age Groups (C 2021) | |
|---|---|
| 0-14 years | 32,714 |
| 15-64 years | 144,277 |
| 65+ years | 54,998 |
| Age Distribution (C 2021) | |
|---|---|
| 80+ years | 12,476 |
| 70-79 years | 26,558 |
| 60-69 years | 32,489 |
| 50-59 years | 34,157 |
| 40-49 years | 34,187 |
| 30-39 years | 28,715 |
| 20-29 years | 20,613 |
| 10-19 years | 21,500 |
| 0-9 years | 21,294 |
| Urbanization (E 2024) | |
|---|---|
| Rural | 89,497 |
| Urban | 135,204 |
| Ethnic Group (C 2021) | |
|---|---|
| Bulgarians | 204,662 |
| Turks | 342 |
| Roma | 11,380 |
| other / indefinable | 963 |
| Mother Tongue (C 2021) | |
|---|---|
| Bulgarian | 199,087 |
| Turkish | 336 |
| Roma | 11,762 |
| other / indefinable | 1,118 |
| Religion (C 2021) | |
|---|---|
| Christians | 177,956 |
| Muslims | 360 |
| Other Religion | 117 |
| No Religion | 7,713 |