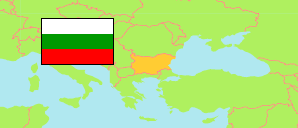
Slivnica
Municipality in Bulgaria
Contents: Population
The population development of Slivnica as well as related information and services (Wikipedia, Google, images).
| Name | Status | Native | Population Census 2001-03-01 | Population Census 2011-02-01 | Population Census 2021-09-07 | |
|---|---|---|---|---|---|---|
| Slivnica [Slivnitsa] | Municipality | Сливница | 10,422 | 9,681 | 8,987 | |
| Bǎlgarija [Bulgaria] | Republic | България | 7,932,984 | 7,364,570 | 6,519,789 |
Source: National Statistical Institute Bulgaria (web).
Further information about the population structure:
| Gender (C 2021) | |
|---|---|
| Males | 4,399 |
| Females | 4,588 |
| Age Groups (C 2021) | |
|---|---|
| 0-14 years | 1,143 |
| 15-64 years | 5,666 |
| 65+ years | 2,178 |
| Age Distribution (C 2021) | |
|---|---|
| 80+ years | 548 |
| 70-79 years | 994 |
| 60-69 years | 1,356 |
| 50-59 years | 1,322 |
| 40-49 years | 1,358 |
| 30-39 years | 1,168 |
| 20-29 years | 729 |
| 10-19 years | 759 |
| 0-9 years | 753 |
| Ethnic Group (C 2021) | |
|---|---|
| Bulgarians | 8,486 |
| Turks | 16 |
| Roma | 150 |
| other / indefinable | 39 |
| Mother Tongue (C 2021) | |
|---|---|
| Bulgarian | 8,421 |
| Turkish | 12 |
| Roma | 101 |
| other / indefinable | 50 |
| Religion (C 2021) | |
|---|---|
| Christian | 7,319 |
| Muslim | 19 |
| Other Religion | 1 |
| No Religion | 316 |