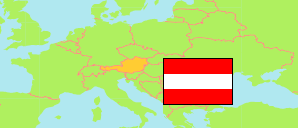
Oberösterreich
State in Austria
Contents: Subdivision
The population development in Oberösterreich as well as related information and services (Wikipedia, Google, images).
| Name | Status | Population Census 1981-05-12 | Population Census 1991-05-15 | Population Census 2001-05-15 | Population Census 2011-10-31 | Population Census 2021-10-31 | Population Estimate 2025-01-01 | |
|---|---|---|---|---|---|---|---|---|
| Oberösterreich [Upper Austria] | State | 1,269,545 | 1,333,480 | 1,376,607 | 1,413,762 | 1,504,237 | 1,535,677 | |
| Braunau | District | 87,061 | 91,463 | 95,166 | 97,826 | 107,643 | 110,571 | → |
| Eferding | District | 27,163 | 28,726 | 30,711 | 31,741 | 33,490 | 33,884 | → |
| Freistadt | District | 57,770 | 61,101 | 63,988 | 65,113 | 67,153 | 68,326 | → |
| Gmunden | District | 90,502 | 95,949 | 99,331 | 99,403 | 102,354 | 103,155 | → |
| Grieskirchen | District | 57,092 | 59,744 | 61,951 | 62,555 | 65,603 | 66,750 | → |
| Kirchdorf | District | 49,605 | 51,608 | 55,161 | 55,557 | 57,501 | 58,199 | → |
| Linz-Land | District | 109,163 | 119,341 | 129,036 | 139,116 | 153,464 | 157,151 | → |
| Linz (Stadt) | District | 199,910 | 203,044 | 183,614 | 189,889 | 206,853 | 213,557 | → |
| Perg | District | 55,808 | 59,056 | 63,944 | 65,738 | 69,809 | 70,985 | → |
| Ried | District | 53,936 | 55,722 | 58,186 | 58,553 | 62,286 | 63,577 | → |
| Rohrbach | District | 54,422 | 55,990 | 57,257 | 56,170 | 56,793 | 57,364 | → |
| Schärding | District | 54,900 | 56,334 | 56,985 | 56,426 | 57,600 | 58,433 | → |
| Steyr-Land | District | 52,858 | 54,590 | 57,604 | 58,700 | 61,240 | 62,613 | → |
| Steyr (Stadt) | District | 38,942 | 39,337 | 39,339 | 38,205 | 37,867 | 38,036 | → |
| Urfahr-Umgebung | District | 61,425 | 70,274 | 78,278 | 81,918 | 87,083 | 88,338 | → |
| Vöcklabruck | District | 114,036 | 120,275 | 126,585 | 130,316 | 139,046 | 141,988 | → |
| Wels-Land | District | 53,892 | 58,332 | 62,990 | 67,945 | 75,270 | 77,110 | → |
| Wels (Stadt) | District | 51,060 | 52,594 | 56,481 | 58,591 | 63,182 | 65,482 | → |
| Österreich [Austria] | Republic | 7,555,338 | 7,795,786 | 8,032,857 | 8,401,940 | 8,969,068 | 9,197,213 |
Source: Statistik Austria.
Explanation: 2025 population figures are final estimates.
Further information about the population structure:
| Gender (E 2025) | |
|---|---|
| Males | 764,417 |
| Females | 771,102 |
| Age Groups (E 2025) | |
|---|---|
| 0-17 years | 277,286 |
| 18-64 years | 948,991 |
| 65+ years | 309,242 |
| Age Distribution (E 2025) | |
|---|---|
| 90+ years | 13,759 |
| 80-89 years | 76,197 |
| 70-79 years | 126,198 |
| 60-69 years | 208,691 |
| 50-59 years | 221,676 |
| 40-49 years | 197,745 |
| 30-39 years | 208,342 |
| 20-29 years | 174,185 |
| 10-19 years | 154,825 |
| 0-9 years | 153,901 |
| Citizenship (E 2025) | |
|---|---|
| Austria | 1,284,655 |
| EU, EFTA, UK | 130,319 |
| Other Citizenship | 120,545 |
| Country of Birth (E 2025) | |
|---|---|
| Austria | 1,253,724 |
| EU, EFTA, UK | 124,652 |
| Other country | 157,143 |