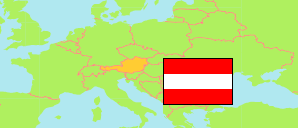
Perg
District in Oberösterreich (Austria)
Contents: Population
The population development of Perg as well as related information and services (Wikipedia, Google, images).
| Name | Status | Population Census 1981-05-12 | Population Census 1991-05-15 | Population Census 2001-05-15 | Population Census 2011-10-31 | Population Census 2021-10-31 | Population Estimate 2024-01-01 | |
|---|---|---|---|---|---|---|---|---|
| Perg | District | 55,808 | 59,056 | 63,944 | 65,738 | 69,809 | 70,864 | |
| Österreich [Austria] | Republic | 7,555,338 | 7,795,786 | 8,032,857 | 8,401,940 | 8,969,068 | 9,159,993 |
Source: Statistik Austria.
Explanation: 2024 population figures are preliminary estimates.
Further information about the population structure:
| Gender (E 2023) | |
|---|---|
| Males | 35,246 |
| Females | 35,270 |
| Age Groups (E 2023) | |
|---|---|
| 0-17 years | 13,702 |
| 18-64 years | 44,093 |
| 65+ years | 12,721 |
| Age Distribution (E 2023) | |
|---|---|
| 90+ years | 495 |
| 80-89 years | 3,272 |
| 70-79 years | 5,038 |
| 60-69 years | 9,031 |
| 50-59 years | 10,953 |
| 40-49 years | 9,130 |
| 30-39 years | 9,406 |
| 20-29 years | 7,942 |
| 10-19 years | 7,586 |
| 0-9 years | 7,663 |
| Citizenship (E 2023) | |
|---|---|
| Austria | 63,329 |
| EU, EEA, Switzerland | 3,825 |
| Other Citizenship | 3,362 |
| Country of Birth (E 2023) | |
|---|---|
| Austria | 62,592 |
| EU, EEA, Switzerland | 3,856 |
| Other country | 4,068 |