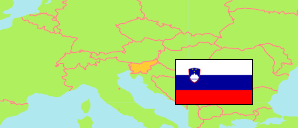
Bohinj
Municipality in Gorenjska
Municipality
The population development of Bohinj.
| Name | Status | Population Census 2002-03-31 | Population Census 2011-01-01 | Population Census 2021-01-01 | Population Estimate 2022-01-01 | |
|---|---|---|---|---|---|---|
| Bohinj | Municipality | 5,222 | 5,257 | 5,611 | 5,676 | → |
| Gorenjska [Upper Carniola] | Region | 195,885 | 203,427 | 211,069 | 211,227 |
Contents: Settlements
The population development of the settlements in Bohinj.
| Name | Status | Municipality | Population Census 2002-03-31 | Population Census 2011-01-01 | Population Census 2021-01-01 | Population Estimate 2022-01-01 | |
|---|---|---|---|---|---|---|---|
| Bohinjska Bistrica | Settlement | Bohinj | 1,774 | 1,799 | 1,867 | 1,891 | → |
| Bohinjska Češnjica | Settlement | Bohinj | 377 | 347 | 327 | 323 | → |
| Gorjuše | Settlement | Bohinj | 151 | 150 | 161 | 163 | → |
| Jereka | Settlement | Bohinj | 212 | 196 | 188 | 194 | → |
| Kamnje | Settlement | Bohinj | 232 | 223 | 220 | 228 | → |
| Koprivnik v Bohinju | Settlement | Bohinj | 214 | 216 | 252 | 240 | → |
| Nemški Rovt | Settlement | Bohinj | 105 | 112 | 126 | 129 | → |
| Nomenj | Settlement | Bohinj | 182 | 173 | 169 | 165 | → |
| Polje | Settlement | Bohinj | 182 | 170 | 219 | 241 | → |
| Ribčev Laz | Settlement | Bohinj | 155 | 147 | 269 | 289 | → |
| Srednja vas v Bohinju | Settlement | Bohinj | 416 | 505 | 494 | 510 | → |
| Stara Fužina | Settlement | Bohinj | 576 | 595 | 613 | 612 | → |
| Studor v Bohinju | Settlement | Bohinj | 109 | 117 | 122 | 119 | → |
Source: Statistical Office of the Republic of Slovenia (web).
Explanation: The 2011 and 2021 population figures are result of a register-based census.