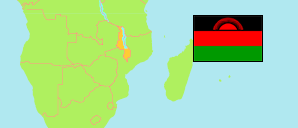
Chitipa
District in Malawi
Contents: Population
The population development of Chitipa as well as related information and services (Wikipedia, Google, images).
| Name | Status | Population Census 1977-09-20 | Population Census 1987-09-01 | Population Census 1998-09-01 | Population Census 2008-06-08 | Population Census 2018-09-03 | Population Projection 2023-09-03 | ||||||||||||
|---|---|---|---|---|---|---|---|---|---|---|---|---|---|---|---|---|---|---|---|
| Chitipa | District | 72,316 | 96,794 | 126,799 | 176,835 | 234,927 | 256,197 | ||||||||||||
Chitipa 256,197 Population [2023] – Projection 4,334 km² Area 59.11/km² Population Density [2023] 1.8% Annual Population Change [2018 → 2023] | |||||||||||||||||||
| Malawi | Republic | 5,547,460 | 7,988,507 | 9,933,868 | 13,029,498 | 17,563,749 | 19,809,511 | ||||||||||||
Source: National Statistical Office of Malawi.
Explanation: Population figures until 1998 are de facto, later figures are de jure.
Further information about the population structure:
| Gender (P 2023) | |
|---|---|
| Males | 124,326 |
| Females | 131,871 |
| Age Groups (P 2023) | |
|---|---|
| 0-14 years | 103,396 |
| 15-64 years | 142,568 |
| 65+ years | 10,233 |
| Age Distribution (P 2023) | |
|---|---|
| 0-9 years | 69,594 |
| 10-19 years | 63,665 |
| 20-29 years | 45,043 |
| 30-39 years | 29,176 |
| 40-49 years | 21,014 |
| 50-59 years | 13,413 |
| 60-69 years | 7,456 |
| 70-79 years | 4,564 |
| 80+ years | 2,272 |
| Urbanization (C 2018) | |
|---|---|
| Rural | 217,184 |
| Urban | 17,743 |
| Citizenship (C 2018) | |
|---|---|
| Malawi | 234,234 |
| Foreign Citizenship | 693 |
| Country of Birth (C 2018) | |
|---|---|
| Malawi | 231,315 |
| Other Country | 3,612 |
| Religion (C 2018) | |
|---|---|
| Christians | 207,468 |
| Muslims | 181 |
| Traditional Religion | 636 |
| Other religion | 25,386 |
| No religion | 1,256 |
| Literacy (A5+) (C 2018) | |
|---|---|
| yes | 163,617 |
| no | 39,505 |
| Tribe (C 2018) | |
|---|---|
| Chewa | 2,539 |
| Tumbuka | 57,301 |
| Lomwe | 200 |
| Yao | 138 |
| Ngoni | 655 |
| Sena | 57 |
| Mang'anja | 99 |
| Other Tribe | 173,245 |
