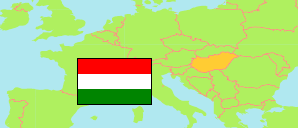
Dombóvár
District in Tolna
District
The population development of Dombóvár.
| Name | Status | Population Census 1980-01-01 | Population Census 1990-01-01 | Population Census 2001-02-01 | Population Census 2011-10-01 | Population Census 2022-10-01 | |
|---|---|---|---|---|---|---|---|
| Dombóvár | District | 37,796 | 35,979 | 35,487 | 32,331 | 29,039 | → |
| Tolna | County | 266,273 | 253,675 | 249,683 | 230,361 | 207,931 |
Contents: Towns and Villages
The population development of the towns and villages in Dombóvár.
| Name | Status | District | Population Census 1980-01-01 | Population Census 1990-01-01 | Population Census 2001-02-01 | Population Census 2011-10-01 | Population Census 2022-10-01 | |
|---|---|---|---|---|---|---|---|---|
| Attala | Village | Dombóvár | 1,062 | 930 | 872 | 858 | 726 | → |
| Csibrák | Village | Dombóvár | 524 | 420 | 423 | 300 | 274 | → |
| Csikóstőttős | Village | Dombóvár | 1,078 | 955 | 983 | 864 | 741 | → |
| Dalmand | Village | Dombóvár | 1,788 | 1,527 | 1,485 | 1,274 | 1,190 | → |
| Döbrököz | Village | Dombóvár | 2,866 | 2,339 | 2,184 | 2,033 | 1,780 | → |
| Dombóvár | Town | Dombóvár | 20,459 | 21,183 | 20,852 | 19,010 | 17,259 | → |
| Gyulaj | Village | Dombóvár | 1,278 | 1,034 | 1,070 | 986 | 821 | → |
| Jágónak | Village | Dombóvár | 401 | 325 | 299 | 238 | 222 | → |
| Kapospula | Village | Dombóvár | 1,072 | 953 | 1,023 | 929 | 826 | → |
| Kaposszekcső | Village | Dombóvár | 1,148 | 1,138 | 1,375 | 1,508 | 1,511 | → |
| Kocsola | Village | Dombóvár | 1,726 | 1,466 | 1,420 | 1,318 | 1,172 | → |
| Kurd | Village | Dombóvár | 1,532 | 1,398 | 1,351 | 1,219 | 1,012 | → |
| Lápafő | Village | Dombóvár | 277 | 204 | 218 | 168 | 135 | → |
| Nak | Village | Dombóvár | 822 | 708 | 690 | 589 | 480 | → |
| Szakcs | Village | Dombóvár | 1,461 | 1,167 | 1,028 | 894 | 770 | → |
| Várong | Village | Dombóvár | 302 | 232 | 214 | 143 | 120 | → |
Source: Hungarian Central Statistical Office.
Explanation: 2022 census results are final.