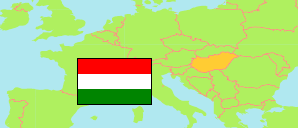
Heves
District in Heves
District
The population development of Heves.
| Name | Status | Population Census 1980-01-01 | Population Census 1990-01-01 | Population Census 2001-02-01 | Population Census 2011-10-01 | Population Census 2022-10-01 | |
|---|---|---|---|---|---|---|---|
| Heves | District | 39,292 | 37,025 | 36,817 | 35,036 | 33,189 | → |
| Heves | County | 350,360 | 334,408 | 325,727 | 308,882 | 285,892 |
Contents: Towns and Villages
The population development of the towns and villages in Heves.
| Name | Status | District | Population Census 1980-01-01 | Population Census 1990-01-01 | Population Census 2001-02-01 | Population Census 2011-10-01 | Population Census 2022-10-01 | |
|---|---|---|---|---|---|---|---|---|
| Átány | Village | Heves | 1,864 | 1,647 | 1,576 | 1,487 | 1,458 | → |
| Boconád | Village | Heves | 1,509 | 1,400 | 1,338 | 1,325 | 1,244 | → |
| Erdőtelek | Village | Heves | 3,628 | 3,428 | 3,545 | 3,329 | 3,266 | → |
| Erk | Village | Heves | 934 | 815 | 831 | 909 | 924 | → |
| Heves | Town | Heves | 11,332 | 11,529 | 11,294 | 10,753 | 9,937 | → |
| Hevesvezekény | Village | Heves | 789 | 777 | 714 | 636 | 633 | → |
| Kisköre | Town | Heves | 3,540 | 3,144 | 3,094 | 2,869 | 2,606 | → |
| Kömlő | Village | Heves | 2,154 | 1,803 | 1,866 | 1,849 | 1,875 | → |
| Pély | Village | Heves | 1,815 | 1,646 | 1,534 | 1,395 | 1,318 | → |
| Tarnabod | Village | Heves | 701 | 630 | 692 | 728 | 695 | → |
| Tarnaméra | Village | Heves | 1,704 | 1,678 | 1,754 | 1,667 | 1,532 | → |
| Tarnaörs | Village | Heves | 1,867 | 1,742 | 1,838 | 1,835 | 1,837 | → |
| Tarnaszentmiklós | Village | Heves | 1,074 | 1,040 | 1,037 | 903 | 766 | → |
| Tarnazsadány | Village | Heves | 1,656 | 1,439 | 1,355 | 1,217 | 1,245 | → |
| Tenk | Village | Heves | 1,038 | 1,098 | 1,207 | 1,203 | 1,129 | → |
| Tiszanána | Village | Heves | 3,009 | 2,662 | 2,657 | 2,505 | 2,288 | → |
| Zaránk | Village | Heves | 678 | 547 | 485 | 426 | 436 | → |
Source: Hungarian Central Statistical Office.
Explanation: 2022 census results are final.