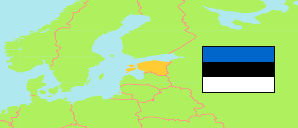
Lääne-Viru
County in Estonia
Contents: Subdivision
The population development in Lääne-Viru as well as related information and services (Wikipedia, Google, images).
| Name | Status | Population Census 2000-03-31 | Population Census 2011-12-31 | Population Census 2021-12-31 | Population Estimate 2025-01-01 | |
|---|---|---|---|---|---|---|
| Lääne-Viru | County | 71,795 | 61,649 | 58,709 | 59,065 | |
| Haljala | Rural Municipality | 4,975 | 4,077 | 4,090 | 3,927 | → |
| Kadrina | Rural Municipality | 5,439 | 4,902 | 4,838 | 4,662 | → |
| Rakvere | Rural Municipality | 6,209 | 5,925 | 5,745 | 5,876 | → |
| Rakvere linn | Urban Municipality | 17,107 | 15,264 | 15,141 | 15,668 | → |
| Tapa | Rural Municipality | 14,073 | 11,772 | 10,901 | 10,940 | → |
| Väike-Maarja | Rural Municipality | 7,654 | 6,049 | 5,664 | 5,615 | → |
| Vinni | Rural Municipality | 8,685 | 7,238 | 6,683 | 6,737 | → |
| Viru-Nigula | Rural Municipality | 7,653 | 6,422 | 5,647 | 5,640 | → |
| Eesti [Estonia] | Republic | 1,370,052 | 1,294,455 | 1,331,824 | 1,369,995 |
Source: Statistical Office of Estonia.
Explanation: Counties and municipalities after the administrative reform of 2017.
Further information about the population structure:
| Gender (E 2025) | |
|---|---|
| Males | 28,298 |
| Females | 30,767 |
| Age Groups (E 2025) | |
|---|---|
| 0-17 years | 11,098 |
| 18-64 years | 33,886 |
| 65+ years | 14,081 |
| Age Distribution (E 2025) | |
|---|---|
| 90+ years | 692 |
| 80-89 years | 3,246 |
| 70-79 years | 6,041 |
| 60-69 years | 8,323 |
| 50-59 years | 8,044 |
| 40-49 years | 7,273 |
| 30-39 years | 7,149 |
| 20-29 years | 5,812 |
| 10-19 years | 6,788 |
| 0-9 years | 5,697 |
| Citizenship (E 2025) | |
|---|---|
| Estonia | 53,362 |
| European Union | 316 |
| Russia | 1,262 |
| Ukraine | 2,350 |
| Other Citizenship | 233 |
| Country of Birth (C 2021) | |
|---|---|
| Estonia | 53,579 |
| Russia | 3,164 |
| Other Country | 1,959 |
| First Language (C 2021) | |
|---|---|
| Estonian | 51,002 |
| Russian | 6,516 |
| Other Language | 979 |
| Ethnic Group (C 2021) | |
|---|---|
| Estonians | 51,028 |
| Russians | 5,385 |
| Other Ethnic Group | 2,124 |
| Religion (C 2021) | |
|---|---|
| Lutherans | 3,730 |
| Orthodox | 3,040 |
| Other Religion | 2,030 |
| No Religion | 35,790 |
