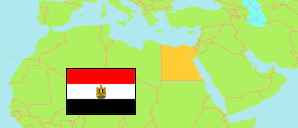
Al-Buḥayrah
Governorate in Egypt
Contents: Subdivision
The population development in Al-Buḥayrah as well as related information and services (Wikipedia, Google, images).
| Name | Status | Native | Population Census 1996-11-19 | Population Census 2006-11-11 | Population Census 2017-03-28 | Population Estimate 2023-07-01 | |
|---|---|---|---|---|---|---|---|
| Al-Buḥayrah [Beheira] | Governorate | البحيرة | 3,994,297 | 4,747,283 | 6,171,613 | 6,878,289 | |
| Abū al-Maṭāmīr | Markaz | مركز ابو المطامير | 291,240 | 394,746 | 553,366 | 607,910 | → |
| Abū Ḥummuṣ | Markaz | مركز ابوحمص | 348,920 | 409,999 | 533,817 | 585,936 | → |
| Ad-Dilinjāt | Markaz | مركز الدلنجات | 255,997 | 304,861 | 398,889 | 441,431 | → |
| Al-Maḥmūdiyah [Mahmoudiyah] | Markaz | مركز المحمودية | 194,704 | 220,699 | 280,382 | 308,140 | → |
| Ar-Raḥmāniyah [Rahmaniya] | Markaz | مركز الرحمانية | 111,826 | 130,457 | 158,015 | 177,554 | → |
| Badr | Markaz | مركز بدر | ... | 156,849 | 207,731 | 228,670 | → |
| Damanhūr [Damanhour] | Kism (fully urban) | قسم دمنهور | 209,423 | 244,043 | 259,213 | 329,572 | → |
| Damanhūr [Damanhour] | Markaz | مركز دمنهور | 384,553 | 441,598 | 546,841 | 590,413 | → |
| Gharb an-Nūbāriyah [West Nubariyah] | Kism (urban and rural parts) | قسم غرب النوبارية | 885 | 39,240 | 118,266 | 131,322 | → |
| Ḥawsh 'Īsā [Hosh Essa] | Markaz | مركز حوش عيسى | 183,362 | 198,610 | 304,699 | 341,942 | → |
| Idkū | Markaz | مركز إدكو | 132,307 | 152,248 | 214,859 | 259,648 | → |
| Ityāy al-Bārūd | Markaz | مركز إيتاى البارود | 338,213 | 378,879 | 474,233 | 524,144 | → |
| Kafr ad-Dawwār [Kafr el-Dawwar] | Kism (urban and rural parts) | قسم كفر الدوار | 232,387 | 262,751 | 302,368 | 346,539 | → |
| Kafr ad-Dawwār | Markaz | مركز كفر الدوار | 449,216 | 523,070 | 699,219 | 754,924 | → |
| Kawm Ḥamādah | Markaz | مركز كوم حمادة | ... | 396,683 | 494,905 | 543,032 | → |
| Rashīd [Rosetta] | Markaz | مركز رشيد | 162,096 | 193,643 | 270,171 | 311,345 | → |
| Shubrākhīt | Markaz | مركز شبراخيت | 201,789 | 226,807 | 276,121 | 304,562 | → |
| Wadi an-Natrun [Natron Valley] | Markaz | مركز وادى النطرون | 25,645 | 72,100 | 78,518 | 91,205 | → |
| Miṣr [Egypt] | Republic | مِصر | 59,276,672 | 72,798,031 | 94,798,827 | 105,174,090 |
Source: Central Agency for Public Mobilization and Statistics (CAPMAS), Egypt.
Explanation: Some figures for 2006 are computed using preliminary census results. Area figures of districts are derived from geospatial data.
Further information about the population structure:
| Gender (E 2023) | |
|---|---|
| Males | 3,541,713 |
| Females | 3,336,576 |
| Age Groups (C 2017) | |
|---|---|
| 0-14 years | 2,169,723 |
| 15-64 years | 3,781,449 |
| 65+ years | 220,441 |
| Age Distribution (C 2017) | |
|---|---|
| 90+ years | 4,082 |
| 80-89 years | 23,677 |
| 70-79 years | 89,686 |
| 60-69 years | 266,228 |
| 50-59 years | 463,221 |
| 40-49 years | 638,321 |
| 30-39 years | 941,567 |
| 20-29 years | 1,028,144 |
| 10-19 years | 1,144,057 |
| 0-9 years | 1,572,630 |
| Urbanization (E 2023) | |
|---|---|
| Rural | 5,453,039 |
| Urban | 1,425,250 |
