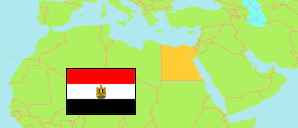
Kafr ash-Shaykh
Governorate in Egypt
Contents: Subdivision
The population development in Kafr ash-Shaykh as well as related information and services (Wikipedia, Google, images).
| Name | Status | Native | Population Census 1996-11-19 | Population Census 2006-11-11 | Population Census 2017-03-28 | Population Estimate 2023-07-01 | |
|---|---|---|---|---|---|---|---|
| Kafr ash-Shaykh [Kafr el-Sheikh] | Governorate | كفر الشيخ | 2,223,383 | 2,620,208 | 3,362,185 | 3,718,316 | |
| Al-Burulus | Markaz | مركز البرلس | 138,164 | 177,976 | 235,051 | 260,814 | → |
| Al-Ḥāmūl | Markaz | مركز الحامول | 198,296 | 249,605 | 289,375 | 319,719 | → |
| Ar-Riyād | Markaz | مركز الرياض | 120,472 | 136,309 | 186,159 | 205,445 | → |
| Biyalā | Kism (fully urban) | قسم بيلا | 56,759 | 66,663 | 80,971 | 90,729 | → |
| Biyalā | Markaz | مركز بيلا | 147,474 | 167,115 | 216,484 | 238,418 | → |
| Disūq [Desouk] | Kism (fully urban) | قسم دسوق | 91,318 | 106,827 | 135,725 | 152,077 | → |
| Disūq [Desouk] | Markaz | مركز دسوق | 292,124 | 331,701 | 410,946 | 452,589 | → |
| Fuwah | Markaz | مركز فوه | 120,806 | 137,735 | 179,002 | 198,765 | → |
| Kafr ash-Shaykh [Kafr el-Sheikh] | Markaz | مركز كفر الشيخ | 295,539 | 345,367 | 446,627 | 492,378 | → |
| Kafr ash-Shaykh 1 [Kafr el-Sheikh] | Kism (fully urban) | قسم أول كفر الشيخ | 98,000 | 117,000 | 140,856 | 157,829 | → |
| Kafr ash-Shaykh 2 [Kafr el-Sheikh] | Kism (fully urban) | قسم ثان كفر الشيخ | 26,000 | 31,000 | 36,027 | 40,368 | → |
| Muṭūbis [Metoubes] | Markaz | مركز مطوبس | 185,523 | 228,802 | 302,241 | 333,635 | → |
| Qallīn | Markaz | مركز قلين | 173,743 | 203,552 | 265,054 | 292,751 | → |
| Sīdī Sālim | Markaz | مركز سيدى سالم | 278,295 | 321,163 | 437,667 | 482,799 | → |
| Miṣr [Egypt] | Republic | مِصر | 59,276,672 | 72,798,031 | 94,798,827 | 105,174,090 |
Source: Central Agency for Public Mobilization and Statistics (CAPMAS), Egypt.
Explanation: Some figures for 2006 are computed using preliminary census results. Area figures of districts are derived from geospatial data.
Further information about the population structure:
| Gender (E 2023) | |
|---|---|
| Males | 1,902,732 |
| Females | 1,815,584 |
| Age Groups (C 2017) | |
|---|---|
| 0-14 years | 1,151,743 |
| 15-64 years | 2,078,559 |
| 65+ years | 131,883 |
| Age Distribution (C 2017) | |
|---|---|
| 90+ years | 2,185 |
| 80-89 years | 14,179 |
| 70-79 years | 53,957 |
| 60-69 years | 158,880 |
| 50-59 years | 272,300 |
| 40-49 years | 351,314 |
| 30-39 years | 490,380 |
| 20-29 years | 561,516 |
| 10-19 years | 618,704 |
| 0-9 years | 838,770 |
| Urbanization (E 2023) | |
|---|---|
| Rural | 2,816,183 |
| Urban | 902,133 |
