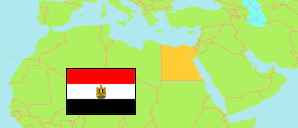
Būr Sa'īd
Governorate in Egypt
Contents: Subdivision
The population development in Būr Sa'īd as well as related information and services (Wikipedia, Google, images).
| Name | Status | Native | Population Census 1996-11-19 | Population Census 2006-11-11 | Population Census 2017-03-28 | Population Estimate 2023-07-01 | |
|---|---|---|---|---|---|---|---|
| Būr Sa'īd [Port Said] | Governorate | بور سعيد | 472,331 | 570,603 | 749,371 | 791,749 | |
| Aḍ-Ḍawāḥy [Al-Dawahy] | Kism (fully urban) | قسم الضواحى | ... | 99,994 | 141,112 | 149,096 | → |
| Al-'Arab [Al-Arab] | Kism (fully urban) | قسم العرب | 58,732 | 46,977 | 57,211 | 60,442 | → |
| Al-Janūb [Al-Ganoub] | Kism (fully urban) | قسم الجنوب | ... | 24,265 | 39,787 | 42,035 | → |
| Al-Janūb 2 [Al-Ganoub] | Kism (fully urban) | قسم ثان الجنوب | ... | 22,052 | 36,341 | 38,393 | → |
| Al-Manākh [Al-Manakh] | Kism (fully urban) | قسم المناخ | ... | 61,346 | 80,396 | 84,949 | → |
| Al-Manāṣrah [Al-Manasra] | Kism (fully urban) | قسم المناصرة | ... | 2,679 | 5,304 | 5,604 | → |
| Ash-Sharq [Al-Sharq] | Kism (fully urban) | قسم الشرق | 30,746 | 29,103 | 32,927 | 34,791 | → |
| Az-Zuhūr [Al-Zohour] | Kism (fully urban) | قسم الزهور | ... | 208,519 | 252,928 | 267,228 | → |
| Būr Fuād [Port Fuad] | Kism (fully urban) | قسم بورفؤاد | ... | 66,379 | 85,015 | 89,826 | → |
| Būr Fuād 2 [Port Fuad] | Kism (fully urban) | قسم ثان بورفؤاد | ... | 6,719 | 11,418 | 12,063 | → |
| Idārah Shurṭah Mīnā' Būr Sa'īd [Police Department Port Said] | Police-administrated Area | إدارة شرطة ميناء بورسعيد | 379 | ... | ... | ... | → |
| Mubārak - Sharq at-Tafrī'tah [Mubarak East] | Kism (fully urban) | قسم مبارك - شرق التفريعة | ... | 2,570 | 6,932 | 7,322 | → |
| Miṣr [Egypt] | Republic | مِصر | 59,276,672 | 72,798,031 | 94,798,827 | 105,174,090 |
Source: Central Agency for Public Mobilization and Statistics (CAPMAS), Egypt.
Explanation: Some figures for 2006 are computed using preliminary census results. Area figures of districts are derived from geospatial data.
Further information about the population structure:
| Gender (E 2023) | |
|---|---|
| Males | 405,992 |
| Females | 385,757 |
| Age Groups (C 2017) | |
|---|---|
| 0-14 years | 204,015 |
| 15-64 years | 500,302 |
| 65+ years | 45,054 |
| Age Distribution (C 2017) | |
|---|---|
| 90+ years | 1,232 |
| 80-89 years | 4,051 |
| 70-79 years | 17,796 |
| 60-69 years | 54,596 |
| 50-59 years | 73,287 |
| 40-49 years | 78,055 |
| 30-39 years | 111,859 |
| 20-29 years | 140,420 |
| 10-19 years | 123,710 |
| 0-9 years | 144,365 |
| Urbanization (E 2023) | |
|---|---|
| Urban | 791,749 |
