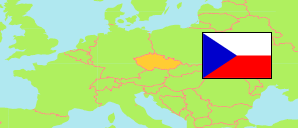
Středočeský kraj
Region in Czech Republic
Contents: Subdivision
The population development in Středočeský kraj as well as related information and services (Wikipedia, Google, images).
| Name | Status | Population Census 2001-03-01 | Population Census 2011-03-26 | Population Census 2021-03-26 | |
|---|---|---|---|---|---|
| Středočeský kraj [Central Bohemian Region] | Region | 1,122,473 | 1,289,211 | 1,415,463 | |
| Benešov | District | 93,156 | 95,459 | 100,347 | → |
| Beroun | District | 75,684 | 86,160 | 98,073 | → |
| Kladno | District | 150,198 | 158,799 | 166,771 | → |
| Kolín | District | 95,796 | 96,117 | 104,227 | → |
| Kutná Hora | District | 73,628 | 73,404 | 74,918 | → |
| Mělník | District | 94,677 | 104,659 | 110,243 | → |
| Mladá Boleslav | District | 114,325 | 123,659 | 128,901 | → |
| Nymburk | District | 84,036 | 94,768 | 102,727 | → |
| Praha-východ [Prague East] | District | 96,061 | 157,146 | 197,477 | → |
| Praha-západ [Prague West] | District | 83,089 | 131,231 | 161,593 | → |
| Příbram | District | 107,739 | 112,816 | 115,001 | → |
| Rakovník | District | 54,084 | 54,993 | 55,185 | → |
| Česká republika [Czech Republic] | Republic | 10,230,060 | 10,436,560 | 10,524,167 |
Source: Czech Statistical Office (web).
Further information about the population structure:
| Gender (C 2021) | |
|---|---|
| Males | 702,541 |
| Females | 712,922 |
| Age Groups (C 2021) | |
|---|---|
| 0-14 years | 253,371 |
| 15-64 years | 895,370 |
| 65+ years | 266,722 |
| Age Distribution (C 2021) | |
|---|---|
| 90+ years | 7,422 |
| 80-89 years | 44,304 |
| 70-79 years | 129,920 |
| 60-69 years | 162,106 |
| 50-59 years | 178,401 |
| 40-49 years | 252,601 |
| 30-39 years | 190,289 |
| 20-29 years | 128,695 |
| 10-19 years | 155,217 |
| 0-9 years | 166,508 |
| Citizenship (C 2021) | |
|---|---|
| Czechia | 1,331,708 |
| Slovakia | 18,318 |
| Ukraine | 26,406 |
| Other Citizenship | 35,899 |
| Ethnic Group (C 2021) | |
|---|---|
| Czechs | 903,714 |
| Moravians | 4,921 |
| Slovaks | 22,453 |
| Ukrainians | 16,199 |
| Other ethnic groups | 39,895 |
