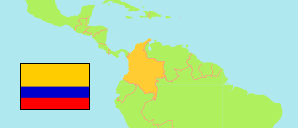
La Paz
Municipality in Cesar
Municipality
The population development of La Paz.
| Name | Status | Population Census 2005-06-30 | Population Census 2018-06-30 | |
|---|---|---|---|---|
| La Paz | Municipality | 21,874 | 27,759 | → |
| Cesar | Department | 913,960 | 1,003,449 |
Contents: Urban Localities
The population development of the urban localities in La Paz.
| Name | Status | Municipality | Population Census 2005-06-30 | Population Census 2018-06-30 | |
|---|---|---|---|---|---|
| Minguillo | Population Center | La Paz | ... | 263 | → |
| Rabo Largo | Population Center | La Paz | ... | 131 | → |
| Robles | Capital | La Paz | 13,351 | 19,622 | → |
| Sabana Alta | Population Center | La Paz | ... | 124 | → |
| San José del Oriente | Population Center | La Paz | 1,498 | 1,985 | → |
| San José de Oriente - Betania | Population Center | La Paz | 1,046 | 1,377 | → |
| Varas Blancas | Population Center | La Paz | 234 | 378 | → |
Source: Departamento Administrativo Nacional de Estadistica, Republica de Columbia (web).
Explanation: In constrast to municipalities and their capitals, the population figures of population centers are not adjusted for underenumeration.