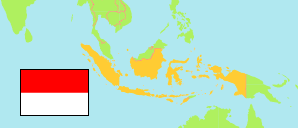
Indonesia: Southeast Sulawesi Province
Contents: Regencies and Cities
The population of the regencies and cities of Southeast Sulawesi Province according the census results.
| Name | Status | Population Census 2005-06-30 | Population Census 2010-05-01 | Population Census 2015-05-01 | Population Census 2020-09-15 | |
|---|---|---|---|---|---|---|
| Bombana | Regency | 105,847 | 139,235 | 164,453 | 150,706 | → |
| Buton | Regency | ... | 94,893 | ... | 115,207 | → |
| Buton Selatan [South Buton] | Regency | ... | 74,707 | ... | 95,261 | → |
| Buton Tengah [Central Buton] | Regency | ... | 86,112 | ... | 114,773 | → |
| Buton Utara [North Buton] | Regency | ... | 54,736 | 59,714 | 66,653 | → |
| Kolaka | Regency | ... | 208,817 | 186,276 | 237,587 | → |
| Kolaka Timur (Koltim) [East Kolaka] | Regency | ... | 106,415 | 177,667 | 120,699 | → |
| Kolaka Utara [North Kolaka] | Regency | 93,427 | 121,340 | 140,338 | 137,659 | → |
| Konawe | Regency | ... | 213,038 | 233,305 | 257,011 | → |
| Konawe Kepulauan [Konawe Islands] | Regency | ... | 28,944 | 31,576 | 37,050 | → |
| Konawe Selatan [South Konawe] | Regency | 228,765 | 264,587 | 294,815 | 308,524 | → |
| Konawe Utara [North Konawe] | Regency | ... | 51,533 | 58,309 | 67,871 | → |
| Kota Bau-Bau | City | 118,998 | 136,991 | 154,570 | 159,248 | → |
| Kota Kendari | City | 236,269 | 289,966 | 346,500 | 345,107 | → |
| Muna | Regency | ... | 196,645 | ... | 215,527 | → |
| Muna Barat [West Marat] | Regency | ... | 71,632 | ... | 84,590 | → |
| Wakatobi | Regency | 96,413 | 92,995 | 94,971 | 111,402 | → |
| Sulawesi Tenggara [Southeast Sulawesi] | Province | 1,963,025 | 2,232,586 | 2,495,248 | 2,624,875 |
Source: Badan Pusat Statistik, Republik Indonesia (web).
Explanation: 2005 and 2015 figures are result of an intermediate census.
Further information about the population structure:
| Gender (C 2020) | |
|---|---|
| Males | 1,330,594 |
| Females | 1,294,281 |
| Age Groups (C 2020) | |
|---|---|
| 0-14 years | 750,986 |
| 15-59 years | 1,751,809 |
| 65+ years | 122,080 |
| Age Distribution (C 2020) | |
|---|---|
| 90+ years | 797 |
| 80-89 years | 12,649 |
| 70-79 years | 54,764 |
| 60-69 years | 128,845 |
| 50-59 years | 226,476 |
| 40-49 years | 329,100 |
| 30-39 years | 406,823 |
| 20-29 years | 469,776 |
| 10-19 years | 493,995 |
| 0-9 years | 501,650 |
