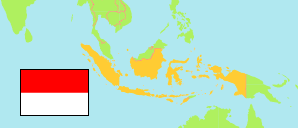
Indonesia: South Borneo Province
Contents: Regencies and Cities
The population of the regencies and cities of South Borneo Province according the census results and latest official projections.
| Name | Status | Population Census 2005-06-30 | Population Census 2010-05-01 | Population Census 2015-05-01 | Population Census 2020-09-15 | |
|---|---|---|---|---|---|---|
| Balangan | Regency | 100,466 | 112,430 | 123,284 | 130,355 | → |
| Banjar | Regency | 459,748 | 506,839 | 553,721 | 565,635 | → |
| Barito Kuala | Regency | 258,682 | 276,147 | 297,944 | 313,021 | → |
| Hulu Sungai Selatan [South Hulu Sungai] | Regency | 203,635 | 212,485 | 226,923 | 228,006 | → |
| Hulu Sungai Tengah [Central Hulu Sungai] | Regency | 236,021 | 243,460 | 259,976 | 258,721 | → |
| Hulu Sungai Utara [North Hulu Sungai] | Regency | 209,107 | 209,246 | 225,158 | 226,727 | → |
| Kota Banjarbaru | City | 152,839 | 199,627 | 233,726 | 253,442 | → |
| Kota Banjarmasin | City | 589,115 | 625,481 | 674,739 | 657,663 | → |
| Kotabaru | Regency | 261,104 | 290,142 | 319,772 | 325,622 | → |
| Tabalong | Regency | 185,889 | 218,620 | 239,302 | 253,305 | → |
| Tanah Bumbu | Regency | 210,287 | 267,929 | 324,361 | 322,646 | → |
| Tanah Laut | Regency | 255,188 | 296,333 | 323,882 | 348,966 | → |
| Tapin | Regency | 149,332 | 167,877 | 181,527 | 189,475 | → |
| Kalimantan Selatan [South Borneo] | Province | 3,281,993 | 3,626,616 | 3,984,315 | 4,073,584 |
Source: Badan Pusat Statistik, Republik Indonesia (web).
Explanation: 2005 and 2015 figures are result of an intermediate census.
Further information about the population structure:
| Gender (C 2020) | |
|---|---|
| Males | 2,062,383 |
| Females | 2,011,201 |
| Age Groups (C 2020) | |
|---|---|
| 0-14 years | 1,096,666 |
| 15-59 years | 2,785,423 |
| 65+ years | 191,495 |
| Age Distribution (C 2020) | |
|---|---|
| 90+ years | 1,214 |
| 80-89 years | 18,307 |
| 70-79 years | 76,846 |
| 60-69 years | 231,791 |
| 50-59 years | 417,348 |
| 40-49 years | 577,074 |
| 30-39 years | 649,518 |
| 20-29 years | 673,145 |
| 10-19 years | 670,188 |
| 0-9 years | 758,153 |
