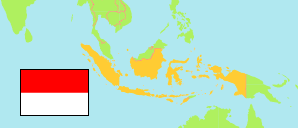
Indonesia: West Java Province
Contents: Regencies and Cities
The population of the regencies and cities of West Java Province according the census results.
| Name | Status | Population Census 2005-06-30 | Population Census 2010-05-01 | Population Census 2015-05-01 | Population Census 2020-09-15 | |
|---|---|---|---|---|---|---|
| Bandung | Regency | ... | 3,178,543 | 3,528,873 | 3,623,790 | → |
| Bandung Barat [West Bandung] | Regency | ... | 1,510,284 | 1,627,816 | 1,788,336 | → |
| Bekasi | Regency | 1,983,815 | 2,630,401 | 3,235,556 | 3,113,017 | → |
| Bogor | Regency | 3,829,053 | 4,771,932 | 5,463,849 | 5,427,068 | → |
| Ciamis | Regency | ... | 1,148,656 | 1,168,254 | 1,229,069 | → |
| Cianjur | Regency | 2,079,770 | 2,171,281 | 2,243,328 | 2,477,560 | → |
| Cirebon | Regency | 2,044,257 | 2,067,196 | 2,124,866 | 2,270,621 | → |
| Garut | Regency | 2,196,422 | 2,404,121 | 2,546,859 | 2,585,607 | → |
| Indramayu | Regency | 1,689,247 | 1,663,737 | 1,690,643 | 1,834,434 | → |
| Karawang | Regency | 1,926,471 | 2,127,791 | 2,271,681 | 2,439,085 | → |
| Kota Bandung | City | 2,288,570 | 2,394,873 | 2,480,615 | 2,444,160 | → |
| Kota Banjar | City | 162,383 | 175,157 | 181,331 | 200,973 | → |
| Kota Bekasi | City | 1,993,478 | 2,334,871 | 2,708,721 | 2,543,676 | → |
| Kota Bogor | City | 891,467 | 950,334 | 1,046,579 | 1,043,070 | → |
| Kota Cimahi | City | 546,879 | 541,177 | 585,931 | 568,400 | → |
| Kota Cirebon | City | 308,771 | 296,389 | 307,319 | 333,303 | → |
| Kota Depok | City | 1,374,903 | 1,738,570 | 2,099,989 | 2,056,335 | → |
| Kota Sukabumi | City | 291,277 | 298,681 | 317,883 | 346,325 | → |
| Kota Tasikmalaya | City | 582,423 | 635,464 | 657,169 | 716,155 | → |
| Kuningan | Regency | 1,045,691 | 1,035,589 | 1,054,862 | 1,167,686 | → |
| Majalengka | Regency | 1,167,566 | 1,166,473 | 1,181,701 | 1,305,476 | → |
| Pangandaran | Regency | ... | 383,848 | 390,316 | 423,667 | → |
| Purwakarta | Regency | 753,306 | 852,521 | 920,639 | 997,869 | → |
| Subang | Regency | 1,380,047 | 1,465,157 | 1,527,952 | 1,595,320 | → |
| Sukabumi | Regency | 2,168,892 | 2,341,409 | 2,433,265 | 2,725,450 | → |
| Sumedang | Regency | 1,014,019 | 1,093,602 | 1,136,816 | 1,152,507 | → |
| Tasikmalaya | Regency | 1,619,052 | 1,675,675 | 1,735,401 | 1,865,203 | → |
| Jawa Barat [West Java] | Province | 38,965,440 | 43,053,732 | 46,668,214 | 48,274,162 |
Source: Badan Pusat Statistik, Republik Indonesia (web).
Explanation: 2005 and 2015 figures are result of an intermediate census.
Further information about the population structure:
| Gender (C 2020) | |
|---|---|
| Males | 24,508,885 |
| Females | 23,765,277 |
| Age Groups (C 2020) | |
|---|---|
| 0-14 years | 11,804,559 |
| 15-59 years | 33,771,420 |
| 65+ years | 2,698,183 |
| Age Distribution (C 2020) | |
|---|---|
| 90+ years | 19,332 |
| 80-89 years | 264,510 |
| 70-79 years | 1,145,375 |
| 60-69 years | 3,034,107 |
| 50-59 years | 5,121,822 |
| 40-49 years | 6,857,447 |
| 30-39 years | 7,773,854 |
| 20-29 years | 8,177,518 |
| 10-19 years | 8,111,707 |
| 0-9 years | 7,768,490 |
