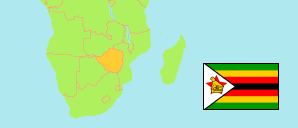
Mashonaland West
Province in Zimbabwe
Contents: Subdivision
The population development in Mashonaland West as well as related information and services (Wikipedia, Google, images).
| Name | Status | Population Census 2002-08-18 | Population Census 2012-08-17 | Population Census 2022-04-20 | |
|---|---|---|---|---|---|
| Mashonaland West | Province | 1,224,670 | 1,501,656 | 1,893,584 | |
| Chegutu Rural | District | 137,336 | 153,655 | 178,911 | → |
| Chegutu Urban | Urban District | 43,424 | 50,590 | 66,260 | → |
| Chinhoyi | Urban District | 55,968 | 77,929 | 103,657 | → |
| Hurungwe (Karoi Rural) | District | 288,100 | 329,197 | 390,897 | → |
| Kadoma Urban | Urban District | 76,351 | 92,469 | 117,381 | → |
| Kariba Rural | District | 34,974 | 41,369 | 45,774 | → |
| Kariba Urban | Urban District | 23,820 | 26,451 | 27,910 | → |
| Karoi | Urban District | 22,383 | 28,606 | 37,564 | → |
| Makonde | District | 117,272 | 153,540 | 209,960 | → |
| Mhondoro-Ngezi | District | 76,571 | 104,342 | 140,994 | → |
| Norton | Urban District | 44,397 | 67,591 | 87,039 | → |
| Sanyati | District | 83,311 | 112,897 | 139,235 | → |
| Zvimba | District | 220,763 | 263,020 | 348,002 | → |
| Zimbabwe | Republic | 11,631,657 | 13,061,239 | 15,178,957 |
Source: Zimbabwe National Statistics Agency (web).
Explanation: Areas figures are computed by using geospatial data.
Further information about the population structure:
| Gender (C 2022) | |
|---|---|
| Males | 934,640 |
| Females | 958,944 |
| Age Groups (C 2012) | |
|---|---|
| 0-14 years | 616,669 |
| 15-64 years | 830,725 |
| 65+ years | 53,200 |
| Age Distribution (C 2012) | |
|---|---|
| 0-9 years | 423,327 |
| 10-19 years | 352,778 |
| 20-29 years | 280,235 |
| 30-39 years | 199,753 |
| 40-49 years | 100,088 |
| 50-59 years | 66,922 |
| 60-69 years | 40,965 |
| 70+ years | 36,526 |
| Urbanization (C 2012) | |
|---|---|
| Rural | 1,124,713 |
| Urban | 376,943 |