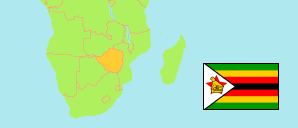
Mashonaland East
Province in Zimbabwe
Contents: Subdivision
The population development in Mashonaland East as well as related information and services (Wikipedia, Google, images).
| Name | Status | Population Census 2002-08-18 | Population Census 2012-08-17 | Population Census 2022-04-20 | |
|---|---|---|---|---|---|
| Mashonaland East | Province | 1,127,413 | 1,344,955 | 1,731,173 | |
| Chikomba | District | 120,248 | 120,986 | 123,932 | → |
| Goromonzi | District | 154,262 | 224,987 | 386,203 | → |
| Hwedza (Wedza) | District | 70,677 | 70,968 | 74,870 | → |
| Marondera Rural | District | 102,830 | 116,985 | 136,173 | → |
| Marondera Urban | Urban District | 51,847 | 61,998 | 66,204 | → |
| Mudzi | District | 128,174 | 133,252 | 158,478 | → |
| Murehwa | District | 162,167 | 199,607 | 205,440 | → |
| Mutoko | District | 132,268 | 146,127 | 161,091 | → |
| Ruwa | Urban District | 23,681 | 56,678 | 94,078 | → |
| Seke | District | 76,923 | 100,756 | 200,478 | → |
| Uzumba-Maramba-Pfungwe (UMP) | District | 104,336 | 112,611 | 124,226 | → |
| Zimbabwe | Republic | 11,631,657 | 13,061,239 | 15,178,957 |
Source: Zimbabwe National Statistics Agency (web).
Explanation: Areas figures are computed by using geospatial data.
Further information about the population structure:
| Gender (C 2022) | |
|---|---|
| Males | 835,092 |
| Females | 896,081 |
| Age Groups (C 2012) | |
|---|---|
| 0-14 years | 561,283 |
| 15-64 years | 714,540 |
| 65+ years | 66,265 |
| Age Distribution (C 2012) | |
|---|---|
| 0-9 years | 381,749 |
| 10-19 years | 321,981 |
| 20-29 years | 223,525 |
| 30-39 years | 163,438 |
| 40-49 years | 90,848 |
| 50-59 years | 68,058 |
| 60-69 years | 45,867 |
| 70+ years | 46,622 |
| Urbanization (C 2012) | |
|---|---|
| Rural | 1,163,667 |
| Urban | 181,288 |