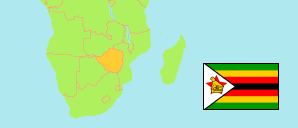
Mashonaland Central
Province in Zimbabwe
Contents: Subdivision
The population development in Mashonaland Central as well as related information and services (Wikipedia, Google, images).
| Name | Status | Population Census 2002-08-18 | Population Census 2012-08-17 | Population Census 2022-04-20 | |
|---|---|---|---|---|---|
| Mashonaland Central | Province | 995,427 | 1,152,520 | 1,384,891 | |
| Bindura Rural | District | 108,594 | 125,219 | 169,841 | → |
| Bindura Urban | Urban District | 33,637 | 43,675 | 51,394 | → |
| Guruve | District | 111,398 | 124,041 | 153,606 | → |
| Mazowe | District | 186,831 | 233,450 | 293,363 | → |
| Mbire | District | 73,901 | 82,380 | 83,720 | → |
| Mount Darwin | District | 199,988 | 212,725 | 240,728 | → |
| Muzarabani (Centenary) | District | 107,777 | 122,791 | 134,076 | → |
| Mvurwi | Urban District | 8,096 | 10,549 | 15,646 | → |
| Rushinga | District | 67,187 | 74,040 | 76,876 | → |
| Shamva | District | 98,018 | 123,650 | 165,641 | → |
| Zimbabwe | Republic | 11,631,657 | 13,061,239 | 15,178,957 |
Source: Zimbabwe National Statistics Agency (web).
Explanation: Areas figures are computed by using geospatial data.
Further information about the population structure:
| Gender (C 2022) | |
|---|---|
| Males | 681,246 |
| Females | 703,645 |
| Age Groups (C 2012) | |
|---|---|
| 0-14 years | 493,153 |
| 15-64 years | 611,419 |
| 65+ years | 46,737 |
| Age Distribution (C 2012) | |
|---|---|
| 0-9 years | 339,197 |
| 10-19 years | 273,379 |
| 20-29 years | 200,713 |
| 30-39 years | 144,734 |
| 40-49 years | 72,408 |
| 50-59 years | 52,792 |
| 60-69 years | 35,782 |
| 70+ years | 32,304 |
| Urbanization (C 2012) | |
|---|---|
| Rural | 1,081,187 |
| Urban | 71,333 |