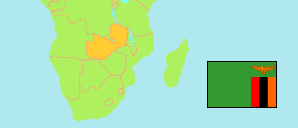
Monze
District in Zambia
Contents: Subdivision
The population in Monze as well as related information and services (Wikipedia, Google, images).
| Name | Status | Population Census 2010-10-16 | |
|---|---|---|---|
| Monze | District | 191,872 | |
| Bbombo | Ward | 5,787 | → |
| Bweengwa | Ward | 7,281 | → |
| Chipembele | Ward | 7,141 | → |
| Chisekesi | Ward | 7,206 | → |
| Chona | Ward | 9,716 | → |
| Choongo East | Ward | 12,798 | → |
| Choongo West | Ward | 3,668 | → |
| Hamamvwa | Ward | 4,290 | → |
| Hamangaba | Ward | 8,461 | → |
| Hatontola | Ward | 11,960 | → |
| Hufwa/Hamapande | Ward | 3,589 | → |
| Kaila | Ward | 7,405 | → |
| Katimba | Ward | 7,051 | → |
| Keemba | Ward | 12,513 | → |
| Malundu | Ward | 8,291 | → |
| Manungu | Ward | 38,590 | → |
| Mayaba | Ward | 4,685 | → |
| Monze Urban | Ward | 1,502 | → |
| Moomba | Ward | 1,010 | → |
| Mwanza East | Ward | 6,286 | → |
| Mwanza West | Ward | 13,041 | → |
| Ufwenuka | Ward | 9,601 | → |
| Zambia | Republic | 13,092,666 |
Source: Central Statistical Office Zambia (web).
Explanation: Districts in the boundaries of 2016 and wards in the the boundaries of 2010; slight deviations from the actual situation are possible. Area figures are computed by using geospatial data.
Further information about the population structure:
| Gender (C 2010) | |
|---|---|
| Males | 93,958 |
| Females | 97,914 |
| Age Groups (C 2010) | |
|---|---|
| 0-14 years | 93,150 |
| 15-64 years | 92,867 |
| 65+ years | 5,855 |
| Age Distribution (C 2010) | |
|---|---|
| 0-9 years | 66,156 |
| 10-19 years | 50,174 |
| 20-29 years | 30,626 |
| 30-39 years | 19,653 |
| 40-49 years | 11,087 |
| 50-59 years | 6,129 |
| 60+ years | 8,047 |
| Urbanization (C 2010) | |
|---|---|
| Rural | 149,982 |
| Urban | 41,890 |