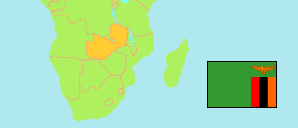
Mazabuka
District in Zambia
Contents: Subdivision
The population in Mazabuka as well as related information and services (Wikipedia, Google, images).
| Name | Status | Population Census 2010-10-16 | |
|---|---|---|---|
| Mazabuka | District | 171,063 | |
| Chivuna | Ward | 19,508 | → |
| Chizobo | Ward | 6,040 | → |
| Itebe | Ward | 2,856 | → |
| Kalama | Ward | 3,351 | → |
| Konkola | Ward | 6,462 | → |
| Lubombo | Ward | 21,496 | → |
| Mazabuka Central | Ward | 58,944 | → |
| Munenga | Ward | 2,713 | → |
| Munjile | Ward | 2,508 | → |
| Musuma | Ward | 5,534 | → |
| Mwanachingwala | Ward | 11,742 | → |
| Nakambala | Ward | 8,565 | → |
| Nega Nega | Ward | 4,787 | → |
| Ngwezi | Ward | 16,557 | → |
| Zambia | Republic | 13,092,666 |
Source: Central Statistical Office Zambia (web).
Explanation: Districts in the boundaries of 2016 and wards in the the boundaries of 2010; slight deviations from the actual situation are possible. Area figures are computed by using geospatial data.
Further information about the population structure:
| Gender (C 2010) | |
|---|---|
| Males | 85,087 |
| Females | 85,976 |
| Age Groups (C 2010) | |
|---|---|
| 0-14 years | 76,165 |
| 15-64 years | 91,654 |
| 65+ years | 3,244 |
| Age Distribution (C 2010) | |
|---|---|
| 0-9 years | 52,717 |
| 10-19 years | 44,841 |
| 20-29 years | 31,793 |
| 30-39 years | 21,088 |
| 40-49 years | 10,786 |
| 50-59 years | 5,098 |
| 60+ years | 4,740 |
| Urbanization (C 2010) | |
|---|---|
| Rural | 97,119 |
| Urban | 73,944 |