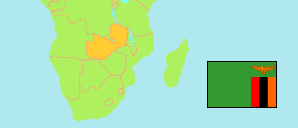
Choma
District in Zambia
Contents: Subdivision
The population in Choma as well as related information and services (Wikipedia, Google, images).
| Name | Status | Population Census 2010-10-16 | |
|---|---|---|---|
| Choma | District | 180,673 | |
| Batoka | Ward | 6,974 | → |
| Chilalantambo | Ward | 9,521 | → |
| Kabimba | Ward | 2,035 | → |
| Kalundana | Ward | 13,142 | → |
| Macha | Ward | 7,501 | → |
| Mang'unza | Ward | 6,132 | → |
| Mapanza | Ward | 5,998 | → |
| Mbabala | Ward | 14,759 | → |
| Moomba | Ward | 3,300 | → |
| Mubula | Ward | 20,838 | → |
| Nakeempa | Ward | 5,595 | → |
| Namuswa | Ward | 11,517 | → |
| Siasikabole | Ward | 8,421 | → |
| Sikalongo | Ward | 8,111 | → |
| Sikalundu | Ward | 9,431 | → |
| Simacheche | Ward | 8,431 | → |
| Simamvwa | Ward | 11,505 | → |
| Simaubi | Ward | 11,991 | → |
| Singani | Ward | 8,927 | → |
| Stateland | Ward | 6,544 | → |
| Zambia | Republic | 13,092,666 |
Source: Central Statistical Office Zambia (web).
Explanation: Districts in the boundaries of 2016 and wards in the the boundaries of 2010; slight deviations from the actual situation are possible. Area figures are computed by using geospatial data.
Further information about the population structure:
| Gender (C 2010) | |
|---|---|
| Males | 88,340 |
| Females | 92,333 |
| Age Groups (C 2010) | |
|---|---|
| 0-14 years | 85,118 |
| 15-64 years | 90,962 |
| 65+ years | 4,593 |
| Age Distribution (C 2010) | |
|---|---|
| 0-9 years | 60,496 |
| 10-19 years | 47,158 |
| 20-29 years | 30,271 |
| 30-39 years | 19,304 |
| 40-49 years | 10,752 |
| 50-59 years | 6,107 |
| 60+ years | 6,585 |
| Urbanization (C 2010) | |
|---|---|
| Rural | 124,176 |
| Urban | 56,497 |