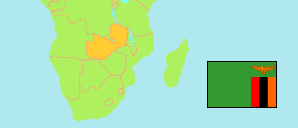
Zambezi
District in Zambia
Contents: Subdivision
The population in Zambezi as well as related information and services (Wikipedia, Google, images).
| Name | Status | Population Census 2010-10-16 | |
|---|---|---|---|
| Zambezi | District | 80,306 | |
| Chileng'a Chizenzi | Ward | 5,096 | → |
| Chitokoloki | Ward | 4,199 | → |
| Chivweji Kasesi | Ward | 6,304 | → |
| Dipalata | Ward | 5,786 | → |
| Likungu | Ward | 4,765 | → |
| Liyovu | Ward | 5,036 | → |
| Lunkunyi | Ward | 4,409 | → |
| Lwitadi Lwatembo | Ward | 3,156 | → |
| Mapachi Chinyingi | Ward | 3,750 | → |
| Matondo Nyachikayi | Ward | 2,739 | → |
| Mpidi Kakong'a | Ward | 7,598 | → |
| Mukanda Nkunda | Ward | 7,567 | → |
| Muyembe | Ward | 1,984 | → |
| Mwange Nyawanda | Ward | 3,698 | → |
| Nyakuleng'a | Ward | 3,920 | → |
| Zambezi | Ward | 10,299 | → |
| Zambia | Republic | 13,092,666 |
Source: Central Statistical Office Zambia (web).
Explanation: Districts in the boundaries of 2016 and wards in the the boundaries of 2010; slight deviations from the actual situation are possible. Area figures are computed by using geospatial data.
Further information about the population structure:
| Gender (C 2010) | |
|---|---|
| Males | 39,278 |
| Females | 41,028 |
| Age Groups (C 2010) | |
|---|---|
| 0-14 years | 39,498 |
| 15-64 years | 37,661 |
| 65+ years | 3,147 |
| Age Distribution (C 2010) | |
|---|---|
| 0-9 years | 28,048 |
| 10-19 years | 20,374 |
| 20-29 years | 12,073 |
| 30-39 years | 8,111 |
| 40-49 years | 4,945 |
| 50-59 years | 2,615 |
| 60+ years | 4,140 |
| Urbanization (C 2010) | |
|---|---|
| Rural | 70,007 |
| Urban | 10,299 |