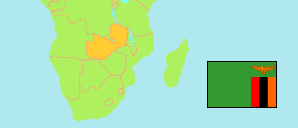
Solwezi
District in Zambia
Contents: Subdivision
The population in Solwezi as well as related information and services (Wikipedia, Google, images).
| Name | Status | Population Census 2010-10-16 | |
|---|---|---|---|
| Solwezi | District | 254,470 | |
| Chikola | Ward | 3,965 | → |
| Chovwe | Ward | 6,685 | → |
| Kalilele | Ward | 3,045 | → |
| Kamalamba | Ward | 19,068 | → |
| Kangwena | Ward | 4,097 | → |
| Kapijimpanga | Ward | 18,307 | → |
| Kibanza | Ward | 5,388 | → |
| Kimasala | Ward | 36,408 | → |
| Lumwana | Ward | 7,501 | → |
| Mapunga | Ward | 3,857 | → |
| Matebo | Ward | 2,391 | → |
| Mujimanzovu | Ward | 2,770 | → |
| Mukumbi | Ward | 8,997 | → |
| Mulonga | Ward | 9,888 | → |
| Mumbezhi | Ward | 1,626 | → |
| Mumena | Ward | 11,810 | → |
| Musaka | Ward | 8,811 | → |
| Musele | Ward | 11,960 | → |
| Mwajimambwe | Ward | 12,654 | → |
| Sandangombe | Ward | 18,361 | → |
| Shilenda | Ward | 16,493 | → |
| Tumvwanganai | Ward | 40,388 | → |
| Zambia | Republic | 13,092,666 |
Source: Central Statistical Office Zambia (web).
Explanation: Districts in the boundaries of 2016 and wards in the the boundaries of 2010; slight deviations from the actual situation are possible. Area figures are computed by using geospatial data.
Further information about the population structure:
| Gender (C 2010) | |
|---|---|
| Males | 126,249 |
| Females | 128,221 |
| Age Groups (C 2010) | |
|---|---|
| 0-14 years | 120,738 |
| 15-64 years | 128,291 |
| 65+ years | 5,441 |
| Age Distribution (C 2010) | |
|---|---|
| 0-9 years | 85,885 |
| 10-19 years | 64,149 |
| 20-29 years | 44,115 |
| 30-39 years | 28,185 |
| 40-49 years | 15,568 |
| 50-59 years | 8,374 |
| 60+ years | 8,194 |
| Urbanization (C 2010) | |
|---|---|
| Rural | 157,745 |
| Urban | 96,725 |