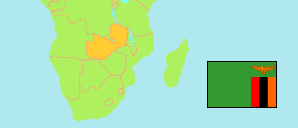
Mporokoso
District in Zambia
Contents: Subdivision
The population in Mporokoso as well as related information and services (Wikipedia, Google, images).
| Name | Status | Population Census 2010-10-16 | |
|---|---|---|---|
| Mporokoso | District | 98,842 | |
| Bwandela | Ward | 4,871 | → |
| Chikulu | Ward | 2,261 | → |
| Chimpolonge | Ward | 3,656 | → |
| Chisha Mwamba | Ward | 8,352 | → |
| Isenga | Ward | 5,018 | → |
| Kalungwishi | Ward | 7,531 | → |
| Kanyanta | Ward | 4,439 | → |
| Kapumo | Ward | 3,726 | → |
| Kasanshi | Ward | 3,679 | → |
| Luangwa | Ward | 6,564 | → |
| Lubushi | Ward | 3,141 | → |
| Lumangwe | Ward | 4,531 | → |
| Lunte | Ward | 7,049 | → |
| Mabale | Ward | 3,113 | → |
| Malaila | Ward | 4,333 | → |
| Malambwa | Ward | 3,549 | → |
| Masonde | Ward | 1,722 | → |
| Mikomba | Ward | 5,424 | → |
| Muchinga | Ward | 4,420 | → |
| Mumbuluma | Ward | 2,492 | → |
| Mutotoshi | Ward | 3,028 | → |
| Nchelenge | Ward | 5,943 | → |
| Zambia | Republic | 13,092,666 |
Source: Central Statistical Office Zambia (web).
Explanation: Districts in the boundaries of 2016 and wards in the the boundaries of 2010; slight deviations from the actual situation are possible. Area figures are computed by using geospatial data.
Further information about the population structure:
| Gender (C 2010) | |
|---|---|
| Males | 49,161 |
| Females | 49,681 |
| Age Groups (C 2010) | |
|---|---|
| 0-14 years | 48,816 |
| 15-64 years | 46,751 |
| 65+ years | 3,275 |
| Age Distribution (C 2010) | |
|---|---|
| 0-9 years | 34,472 |
| 10-19 years | 25,103 |
| 20-29 years | 14,790 |
| 30-39 years | 10,031 |
| 40-49 years | 6,300 |
| 50-59 years | 3,505 |
| 60+ years | 4,641 |
| Urbanization (C 2010) | |
|---|---|
| Rural | 83,286 |
| Urban | 15,556 |